Showing posts with label bar. Show all posts

Wednesday, October 3, 2012

Progress bar for long running process with steps using asp.net, C#, SignalR

I have come across with many questions regarding implementing progress of some long running operations in asp.net application. And I could not see any way to solve this problem directly in asp.net. Even with ajax call to get what step is running is not possible because once a long process has started, the server cannot listen to an ajax request until the previous step is finished. This is because the processing is done as a single thread.

Thanks to Microsoft for VS 2010 and SignalR.

Here we will try to implement a demo progress of long running application step by step using SignalR and visual studio 2010.

Step 1- Install signal R
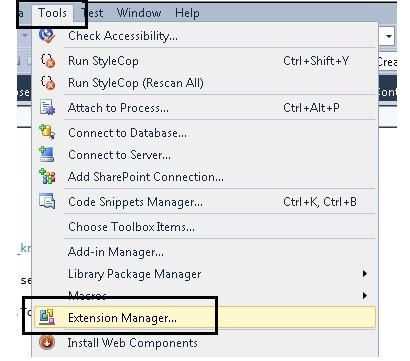
Check whether NuGet package manager is installed with your visual studio. If not go to tool -> Extension manager this will pop up the following window-
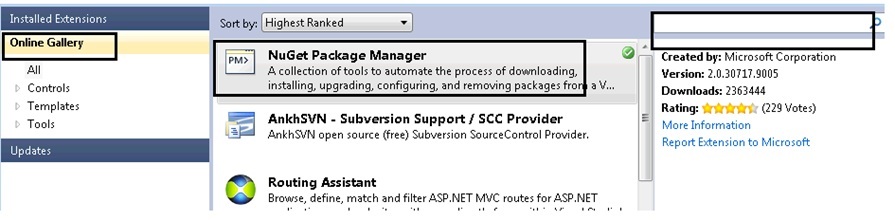

Go to online gallery, if you cannot see NuGet Package Manager, then search on the search box on the left side. Install it.

Create a web application with dot net framework 4, and then right click on the project and then click on Manage NuGet Packages… This will pop up the above window again like below-


Go to online then type signalr in the search box. This will list SignalR as the first item. Click on install.

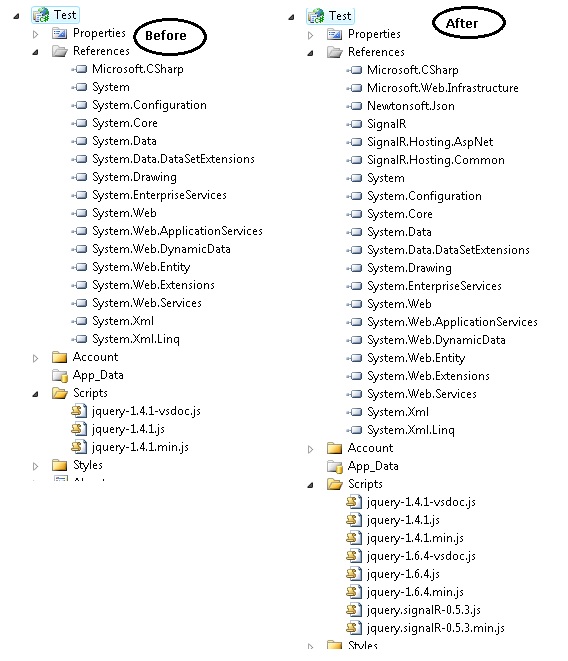
If you note down the reference of your project and the js file you can see the following difference-


Step 2-
First we will create a class named ServerComplexObjectand inherit this from SignalR.Hubs.Hub. And we will add a method named ComplexProcess() like below-
    public class ServerComplexObject:SignalR.Hubs.Hub {
        public void ComplexProcess()
        {
            System.Threading.Thread.Sleep(2000);
            Clients.AddProgress("Step 1 of 5 has completed.");
            System.Threading.Thread.Sleep(2000);
            Clients.AddProgress("Step 2 of 5 has completed.");
            System.Threading.Thread.Sleep(3000);
            Clients.AddProgress("Step 3  of 5 has completed.");
            System.Threading.Thread.Sleep(1000);
            Clients.AddProgress("Step 4 of 5 has completed.");
            System.Threading.Thread.Sleep(4000);
            Clients.AddProgress("Step 5 of 5 has completed.",true);
        }
    }
We have just used Sleep method of thread to simulate long running process. Here Clients is a dynamic property of Hub which represents all clients connected to the Hub. And AddProgress is a dynamic expression that will get invoked by the server. And a JavaScript method with exactly same name should be present in the client side.

Step 3-
Now to call this we have to take the reference of the appropriate JavaScript files and this are-
    <script src="Scripts/jquery-1.6.4.js" type="text/javascript"></script>
    <script src="Scripts/jquery.signalR-0.5.3.js" type="text/javascript"></script>
    <script src="signalr/hubs" type="text/javascript"></script>
Now we will have the following HTML-
    <div class="prgressBar" style="width:300px; padding-top:32px">
        <div class="bar" ></div>
    </div>
    <input id="btn" value="start process" type="button" />
In this first di is used to show the progress bar and the second button is used to start the process.

Step 4-
Now we have to do 4 steps to do the sample working-
  1. Create a proxy of the server object.
  2. Add a method with the same name "AddProgress".
  3. Start the hub for listening.
  4. And finally start the complex process from client.
And the code goes like below-
   <script type="text/javascript">
        var img = new Image();
        img.src = "https://cms.unov.org/FullTextSearch/Common/Images/progress.gif";
        $(document).ready(function () {
            var myConnection = $.connection.serverComplexObject;
            myConnection.AddProgress = function (message, completed) {
                $(".prgressBar .bar").html(message);
                if (completed) {
                    $(".prgressBar").removeClass("rotating");
                    $(".prgressBar .bar").html("process completed");
                }
            }
            $("#btn").click(function () {
                $(".prgressBar").addClass("rotating");
                myConnection.complexProcess();
            });
            $.connection.hub.start();
        });
    </script>
Let me list the above steps again
  1. Create a proxy of the server object.(var myConnection = $.connection.serverComplexObject;)
  2. Add a method with the same name "AddProgress".(myConnection.AddProgress = function (message, completed) {)
  3. Start the hub for listening.($.connection.hub.start();)
  4. And finally start the complex process from client.(myConnection.complexProcess();)
Now one thing you can note that serverComplexObject is same as the class name with first letter lowercased. Same is with complexProcess server method. That’s done. You can download the code to see the process in action.

Wednesday, June 6, 2012

jqPlot bar graph with asp.net MVC 3

In this post we will be exploring using jqPlot bar graph with asp.net MVC 3. We can download the plugin for the below location-

http://www.jqplot.com/

To start with let’s see how bar graph works. Following is code for a bar graph with HTML and JavaScript bar data object-
<link class="include" rel="stylesheet" type="text/css" href="@Url.Content("~/scripts/jqplot/css/jquery.jqplot.min.css")" />
<!--[if lt IE 9]><script language="javascript" type="text/javascript" src="@Url.Content("~/scripts/jqplot/excanvas.min.js")"></script><![endif]-->
<script type="text/javascript" src="@Url.Content("~/scripts/jqPlot/jquery.jqplot.min.js")"></script>
@*<script type="text/javascript" src="@Url.Content("~/scripts/jqplot/jqplot.canvasTextRenderer.min.js")"></script>
<script type="text/javascript" src="@Url.Content("~/scripts/jqplot/jqplot.canvasAxisTickRenderer.min.js")"></script>*@
<script type="text/javascript" src="@Url.Content("~/scripts/jqplot/jqplot.categoryAxisRenderer.min.js")"></script>
<script type="text/javascript" src="@Url.Content("~/scripts/jqPlot/jqplot.barRenderer.min.js")"></script>

<div class="example-content">
    <!-- Example scripts go here -->
    <style type="text/css">
        .jqplot-target
        {
            margin: 30px;
        }
        .tooltipCss
        {
            position: absolute;
            background-color: #b2b1ac;
            color: White;
            z-index: 200;
            padding: 5px;
            border-radius: 5px;
            display: none;
        }
    </style>
    <div id="chart2" class="plot" style="width: 760px; height: 360px;">
    </div>
</div>
<script language="javascript" type="text/javascript">
    $(document).ready(function () {
        pop1980 = [4, 5, 3, 6, 5, 4, 2, 5];
        pop1990 = [3, 5, 6, 2, 4, 3, 4, 6];
        pop2000 = [2, 5, 6, 3, 4, 5, 2, 4];
        pop2008 = [5, 3, 4, 2, 6, 5, 2, 4];

        ticks = [5, 6, 7, 8, 9, 10, 11, 12];

        series = [
                  { label: 'r. DMR Published - Singapore' },
                  { label: 's. DMR Published - London' },
                  { label: 't. DMR Published - Houston' },
                  { label: 'u. DMR Published - Global' }
               ];

        plot2 = $.jqplot('chart2', [pop1980, pop1990, pop2000, pop2008], {
            legend: {
                show: true,
                placement: 'outsideGrid'
            },
            seriesDefaults: {
                renderer: $.jqplot.BarRenderer,
                rendererOptions: {
                    barPadding: 5
                }
            },
            series: series,
            axes: {
                xaxis: {
                    renderer: $.jqplot.CategoryAxisRenderer,
                    ticks: ticks
//                    ,
//                    tickRenderer: $.jqplot.CanvasAxisTickRenderer,
//                    tickOptions: {
//                        angle: -15
//                    }
                }
            }
        });
        $('#chart2').bind('jqplotDataMouseOver',
            function (ev, seriesIndex, pointIndex, data) {
                $('#info2').html('series "' + series[seriesIndex].label + '" point "' + (pointIndex + 5) + '"<br /> value "' + data[1] + '"');
                $('#info2').css({ "left": ev.pageX + 3, "top": ev.pageY })
                $('#info2').show();
            }
        );
        $('#chart2').bind('jqplotDataUnhighlight',
            function (ev) {
                $('#info2').hide();
            }
        );
    });
</script>
<div id="info2" class="tooltipCss">
</div>
If you check the file references, you can check a file named excanvas.min.js. This is the file for internet explorer less than 9. As the bar is rendered in canvas, a HTML 5 feature, which is not supported in lower versions of IE. All other files are required for bar graph. If you notice, you can see there are two files that are commented out (jqplot.canvasTextRenderer.min.js and jqplot.canvasAxisTickRenderer.min.js ). These two files are needed if you want to rotate the tick texts in both the axis. In the bar initialization you can find the corresponding tickRenderer code is commented out for x-axis. Div with id chart2 is used to hold the bar graph. And div with id info2 is used to hold tooltip content. Input to the graph is array of arrays where each inner array represents data for each bar.

Number of items in each inner array is same. Other than this array there are two more arrays used. One is ticks, this is used to represent the data interval in x- axis. And another is series, this array is used to represent the name of each bar. The order of the series item should be same as the order of the data input arrays.

There are many options used in the plugin. Detail of various options can be found here-

http://www.jqplot.com/docs/files/jqPlotOptions-txt.html
http://www.jqplot.com/docs/files/optionsTutorial-txt.html

We can use as many options required in this case.

Other than these we are using two more events in the plugin named 'jqplotDataMouseOver' and 'jqplotDataUnhighlight'. We are using these events to track tooltips in each bar. We can add debugger and check what is happening.

Model driven Bar Graph:

To make the graph model driven we can have the following model-
namespace Bar.Models
{
    public class BarViewModel
    {
        public int Id { get; set; }
        public string BarName { get; set; }
        public int[] Values { get; set; }
    }
    public class BarDataViewModel
    {
        public int[] TickValues { get; set; }
        public List<BarViewModel> Data { get; set; }
    }
}
And in the controller action we are creating the data in memory as –
        public ActionResult ModelDrivenBar()
        {
            BarDataViewModel data = new BarDataViewModel();
            data.Data = new List<BarViewModel>();
            BarViewModel bar;
            Random r=new Random();
            for (int i = 0; i < 4; i++)
            {
                bar = new BarViewModel();
                bar.Id = i;
                bar.BarName = "Bar Name " + i.ToString();
                bar.Values = new int[10];
                for (int j = 0; j < 10; j++)
                    bar.Values[j] = r.Next(2, 6);
                data.Data.Add(bar);
            }
            data.TickValues = new int[10];
            for (int i = 5; i < 15; i++)
                data.TickValues[i - 5] = i;
            return View(data);
        }
We need to do two changes in the view to accommodate the changes. First add the following line at the starting of the view-
@model Bar.Models.BarDataViewModel
And secondly generate the three arrays, as we have discussed earlier, like below-
        var data = new Array();
        var ticks = new Array();
        var series = new Array();
        @foreach (var d in Model.TickValues)
        {
            <text>ticks.push(</text>@d<text>);</text>
        }
        @foreach (var d in Model.Data)
        {
            <text>var bar</text>@d.Id<text>= new Array();</text>
            <text>series.push({label : "</text>@d.BarName<text>"});</text>
            foreach (var darray in d.Values)
            { 
                <text>bar</text>@d.Id<text>.push(</text>@darray<text>);</text>
            }
            <text>data.push(bar</text>@d.Id<text>);</text>
        }
        plot2 = $.jqplot('chart2', data, {
Instead of explaining the code above, we can check the output of the code below-
        var data = new Array();
        var ticks = new Array();
        var series = new Array();
            ticks.push(5);
            ticks.push(6);
            ticks.push(7);
            ticks.push(8);
            ticks.push(9);
            ticks.push(10);
            ticks.push(11);
            ticks.push(12);
            ticks.push(13);
            ticks.push(14);
            var bar0= new Array();
            series.push({label : "Bar Name 0"});
                bar0.push(2);
                bar0.push(4);
                bar0.push(5);
                bar0.push(5);
                bar0.push(4);
                bar0.push(3);
                bar0.push(2);
                bar0.push(2);
                bar0.push(3);
                bar0.push(5);
            data.push(bar0);
            var bar1= new Array();
            series.push({label : "Bar Name 1"});
                bar1.push(4);
                bar1.push(2);
                bar1.push(2);
                bar1.push(5);
                bar1.push(2);
                bar1.push(3);
                bar1.push(4);
                bar1.push(5);
                bar1.push(5);
                bar1.push(2);
            data.push(bar1);
            var bar2= new Array();
            series.push({label : "Bar Name 2"});
                bar2.push(4);
                bar2.push(3);
                bar2.push(3);
                bar2.push(4);
                bar2.push(2);
                bar2.push(2);
                bar2.push(2);
                bar2.push(3);
                bar2.push(4);
                bar2.push(5);
            data.push(bar2);
            var bar3= new Array();
            series.push({label : "Bar Name 3"});
                bar3.push(5);
                bar3.push(4);
                bar3.push(5);
                bar3.push(2);
                bar3.push(4);
                bar3.push(3);
                bar3.push(5);
                bar3.push(4);
                bar3.push(3);
                bar3.push(5);
            data.push(bar3);
        plot2 = $.jqplot('chart2', data, {
What we are doing here is just creating the bar data dynamically by looping the model data.

Ajax Bar Graph:

To make it ajax driven we can simply change the controller return type like below-
        public JsonResult AjaxBarData()
        {
            //same code like earlier
            return Json(data,JsonRequestBehavior.AllowGet);
        }
And we can do an ajax call to the controller and in the success of the ajax call we can initialize the graph-
<script type="text/javascript">
    $(document).ready(function () {
        $.ajax({
            type: "get",
            timeout: 30000,
            url: '@Url.Action("AjaxBarData")',
            dataType: "json",
            contentType: "application/json; charset=utf-8",
            success: function (result) {
                var data = new Array();
                var ticks = new Array();
                var series = new Array();
                $(result.TickValues).each(function (i, itm) {
                    ticks.push(itm);
                });
                $(result.Data).each(function (i, itm) {
                    series.push({ label: itm.BarName });
                    data[i] = new Array();
                    $(itm.Values).each(function (j, item) {
                        data[i].push(item);
                    });
                });
  //initialize the bar graph here
                plot2 = $.jqplot('chart2', data, {
            },
            error: function (req, status, error) {
                debugger;
            }
        });
    });
</script>
That’s all. You can download the bar code here.