Tuesday, July 10, 2012

Restrict datepicker date using database driven dates

In this post we will be discussing restricting dates in jQuery UI datepicker dates using database driven dates.

We can restrict date using beforeShowDay event of the datepicker. Inside this function we can return [true] if we want the date to be enabled and return [false] if we want to disable date.

Let’s first get the date from server. For simplicity we will simply return an in memory date array like below-
    [WebMethod]
    public static List<string> GetDates()
    { 
        List<string> arr= new List<string>();
        arr.Add("2012-07-12");
        arr.Add("2012-07-25");
        arr.Add("2012-07-28");
        arr.Add("2012-07-13");
        arr.Add("2012-07-20");
        return arr;
    }
We can call this method from jQuery ajax like below-
<html xmlns="http://www.w3.org/1999/xhtml">
<head id="Head1" runat="server">
    <script src="http://ajax.aspnetcdn.com/ajax/jQuery/jquery-1.7.js" type="text/javascript"></script>
    <script src="http://ajax.aspnetcdn.com/ajax/jquery.ui/1.8.9/jquery-ui.js" type="text/javascript"></script>
    <link href="http://ajax.aspnetcdn.com/ajax/jquery.ui/1.8.9/themes/redmond/jquery-ui.css"
        rel="stylesheet" type="text/css" />
    <script type="text/javascript">
        $(function () {
            $.ajax({
                type: "POST",
                contentType: "application/json",
                data: "{}",
                url: "jquery datepicker fill with sql database dates.aspx/GetDates",
                dataType: "json",
                success: function (data) {
                    //enable date picker 
                },
                error: function (XMLHttpRequest, textStatus, errorThrown) {
                    debugger;
                }
            });
        });
    </script>
</head>
<body>
    <form id="form1" runat="server">
    <div>
        <asp:TextBox ID="TextBox1" runat="server"></asp:TextBox>
    </div>
    </form>
</body>
</html>
In the success method we can enable the datepicker and restrict the date by using the date from server (data.d). The code goes here-
$('#TextBox1').datepicker({
        minDate: new Date(2012, 6, 10),
        maxDate: new Date(2012, 8, 28),
        beforeShowDay: function (date) {
            function addZero(no) {
                if (no < 10) {
                    return "0" + no;
                } else {
                    return no;
                }
            }

        var date_str = [
        addZero(date.getFullYear()),
        addZero(date.getMonth() + 1),
        addZero(date.getDate())
        ].join('-');

        if ($.inArray(date_str, data.d) != -1) {
            return [true];
        } else {
            return [false];
        }
    }
});
What we are doing inside beforeShowDay is preparing the date string(date_str) in the format yyyy-mm-dd and then checking whether this date exists in the array data.d. If exists return [true] else return [false].

Wednesday, June 27, 2012

Copy a network (shared folder) file using c#

Recently I came across a requirement to copy a network file (shared folder file) in regular time interval. I tried many options. Finally following approach worked properly.

We can do following-
  1. Login to a user account using c#.
  2. Impersonate as the logged in user.
  3. Copy the file using System.IO.File.Copy.

For step 1 we can login to a user account using LogonUser of advapi32.dll. To consume this method we need to do dll import as follows. We can add the following method in the current class-
[System.Runtime.InteropServices.DllImport("advapi32.dll", SetLastError = true, CharSet = System.Runtime.InteropServices.CharSet.Unicode)]
public static extern bool LogonUser(String lpszUsername, String lpszDomain, String lpszPassword, int dwLogonType, int dwLogonProvider, ref IntPtr phToken);
We can see the detail of the method here-

http://msdn.microsoft.com/en-us/library/windows/desktop/aa378184%28v=vs.85%29.aspx

Next we can call the method like below-
IntPtr tokenHandle = new IntPtr(0);
bool returnValue = LogonUser("usermane", "domain", "password", 2, 0, ref tokenHandle);
if (!returnValue)
throw new Exception("Logon failed.");
For step 2 we can impersonate the logon user by the Impersonate method of WindowsIdentity class as follows-
System.Security.Principal.WindowsImpersonationContext impersonatedUser = null;
System.Security.Principal.WindowsIdentity wid = new System.Security.Principal.WindowsIdentity(tokenHandle);
impersonatedUser = wid.Impersonate();
And finally for step 3 we can copy the file as-
System.IO.File.Copy("SourceFile", "DestinationFile", true);
For source and the destination file either a network file or a local file. We also need to take care of proper access right of the shared folder.

Wednesday, June 13, 2012

Passing extra parameters with dataTable.net plugin while server paging is enabled in asp.net MVC 3 and Web form

Recently I have added two posts to implement dataTable.net jQuery plugin with server side paging with MVC3 and asp.net web form. First one is in MVC 3 and second one is in web form. We can find these two posts here-

http://growingtech.blogspot.in/2012/06/ajax-data-paging-with-datatablesnet.html
http://growingtech.blogspot.in/2012/06/ajax-data-paging-with-datatablesnet_06.html

I will request to study these two posts in sequentially to understand this one.

In this post we will be discussing how to pass additional parameters when page index changes happen in dataTable.net. To pass additional parameters in ajax paging we can use fnServerParams function of dataTable. In the MVC post we have discussed how dataTable plugin adds request parameters as querystring. And this function (fnServerParams) provides an input parameter which is nothing but an array of the query string parameters. We can do modification to the array in the function to accomodiate our need of extra parameters. Each array element in the input array is an object of the following form-
{ "name": "name of parameter/querystring", "value": "value of parameter/querystring " }
So, we can add our additional parameter accordingly. Suppose we have following input data as additional parameter-
First Criteria: <input id="txtParameter1" /><br />
Second Criteria : <input id="txtParameter2" />
We can add the these extra parameter like below-
<script type="text/javascript" charset="utf-8">
    $(document).ready(function () {
        $('#example').dataTable({
            "bServerSide": true,
            "bProcessing": true,
            "sPaginationType": "full_numbers",
            "sAjaxSource": 'Datatable Plugin Pagination Issue AjaxPath.aspx',
            "fnServerParams": function (aoData) {
                aoData.push(
                    { "name": "firstcriteria", "value": $("#txtParameter1").val() },
                    { "name": "secondcriteria", "value": $("#txtParameter2").val() }
                );
            }
        });
    });
</script>
In web form:

In web form we can access these parameters like below and use for database operations –
var firstCriteria = Request.QueryString["firstcriteria"];
var secondCriteria = Request.QueryString["secondcriteria"];
In MVC 3-

To use in MVC 3 we can modify data model like below to accommodate our new parameters-
    public class TableParameter
    {
        public string sEcho { get; set; }
        public int iDisplayStart { get; set; }
        public int iDisplayLength { get; set; }
        public string firstcriteria { get; set; }
        public string secondcriteria { get; set; }
    }
Input data will be available in the controller method to use.

Replace smiley code with images in a chat application in JavaScript

Many application supports adding smiley. In the text area, used for typing, we enter some text code like :) and on enter we can we can see in the history of chat this gets converted to smiley image. We can implement this by-
<script type="text/javascript">
    var replacement = { ":)": "<img src='smiley1.png' />", ":(": "<img src='smiley2.png' />", ":-)": "<img src='smiley3.png' />" };
    var string = ":) is a smily where :( another. :-) is one more";
    string = escape(string);
    for (var val in replacement)
        string = string.replace(new RegExp(escape(val), "g"), replacement[val]);
    string = unescape(string);
</script>
Special characters are not properly recognized in this case. That why escape and unescape is used.

Tuesday, June 12, 2012

Its time for free data storage - SkyDrive

Looking for a free space in the sky(http://www). It time to celebrate. Microsoft is providing up to 7 GB free space in https://skydrive.live.com/. You can use this for free data storage.

You can install the sky tool in your system and event configure a folder with the tool. The tool will take care of sinking your folder data in in the sky.

Its great. For detail check this-

http://windows.microsoft.com/en-in/skydrive/home

Getting started with amazon simple storage service (S3) with dot net

Recently I was getting hard time to work with amazon S3 with C#. I am sharing my experience here. To start with we can create an account in http://aws.amazon.com/. It’s free to create an account here. But we have to pay for the services we want to use. There are many services available. We can choose what we need.

I had a requirement to save a file in the cloud, a json file. And periodically update the file. It’s just a storage need. So we have chosen the S3.

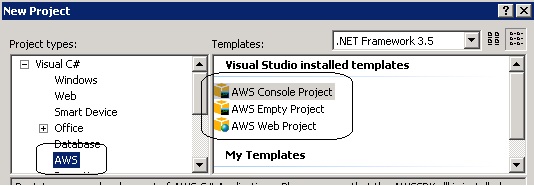
Now before going forward as we are supposed to do the uploading with C#, let’s first download the dot net SDK from http://aws.amazon.com/sdkfornet/ and install the SDK. This installation will give new project templates for working with cloud. After installation there will be following project templates available for development.


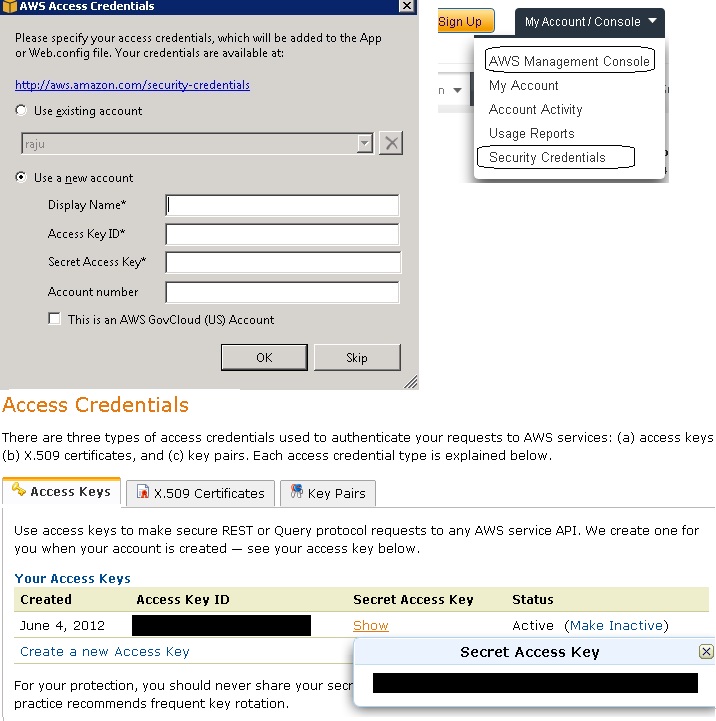
If we choose any of the three project types and create a project we will get a popup asking Display name, Access Key Id, Secret Access Key. To get the keys we can go to own account (click on My Account/Console Link on the top) then go to Security Credentials. If we are able to visit page we will get Access Credentials like in the image below. Here I have blacked out my credentials. We can now fill the credentials and click ok. For the name we can choose any name. VS will save this name for shortcut of the given credentials. If we visit the web config or appconfig we can see the following app keys-
 <appSettings>
  <add key="AWSAccessKey" value="********************"/>
  <add key="AWSSecretKey" value="****************************************"/>
</appSettings>
Also the template will add a dll named AWSSDK.dll to the solution which contains the API library needed to communicate with S3 cloud.

If not able to visit credential page, no need to worry we will get there soon.


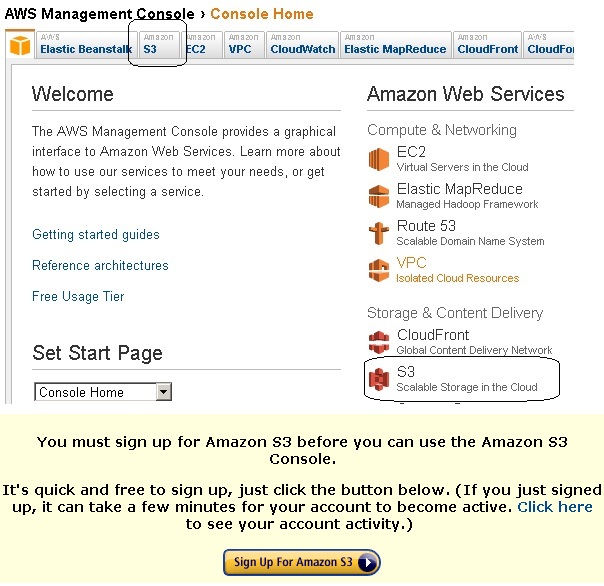
Now we can go to the management console. In the above image we can click AWS Management Console. We will go the console page. From the page we can choose S3. We can find it in two place- top tab and under Amazon Web Services. Both are marked in the image below. If we have created a normal account, we will not be able to do anything. We will get the message in the yellow background as in the image.


To consume this we have to signup (purchase) S3 here. As discussed earlier if we are not able to find the credentials, we will be able to find after purchase.

After we have signed up we can go to the console. And we can see two sections. Left is bucket and right is files and folders. To add any file we need to have a bucket. We can consider a bucket is nothing but a grouping of files and folders. We can group file in different folder hierarchy in the right side. To create a bucket we can chose create bucket button in the left side. We can give a name and select a region. We can create and delete a bucket from C# like this-

Create a bucket:
Amazon.S3.AmazonS3 s3Client = Amazon.AWSClientFactory.CreateAmazonS3Client();
Amazon.S3.Model.PutBucketRequest bucket = new Amazon.S3.Model.PutBucketRequest();
bucket.BucketName = "ag_testbucket";
bucket.BucketRegion = Amazon.S3.Model.S3Region.US;
s3Client.PutBucket(bucket);
What we are doing here is creating an amazon S3 object. And then creating a PutBucketRequest object and using the S3 object we are creating the bucket. Similarly we can delete a bucket using DeleteBucketRequest object like below-

Delete a bucket:
Amazon.S3.AmazonS3 s3Client = Amazon.AWSClientFactory.CreateAmazonS3Client();
Amazon.S3.Model.DeleteBucketRequest bucketDelete=new Amazon.S3.Model.DeleteBucketRequest();
bucketDelete.BucketName = "ag_testbucket";
s3Client.DeleteBucket(bucketDelete);
Create and update a file in cloud:
Amazon.S3.AmazonS3 s3Client = Amazon.AWSClientFactory.CreateAmazonS3Client();
try
{
    string strBucketName="your_bucket_name";
    Amazon.S3.Model.ListBucketsResponse response = s3Client.ListBuckets();
    if (response.Buckets != null && response.Buckets.Where(b=>b.BucketName==strBucketName).Count()>0)
    {
        String strFileName = "test.txt";
        PutObjectRequest request = new PutObjectRequest();
        request.WithBucketName(strBucketName);
        request.WithKey(strFileName);

        //create data and add with the following line

        request.WithContentBody("sone dummy text");

        PutObjectResponse objResponse = s3Client.PutObject(request);
    }
}
catch (AmazonS3Exception ex)
{
}
To create and upload a text file using S3, we need to create an S3 client and then we have to use a bucket to upload the file. By if statement we are checking whether the bucket being used is available or not. And then we are uploading the file in the bucket.

Wednesday, June 6, 2012

jqPlot bar graph with asp.net MVC 3

In this post we will be exploring using jqPlot bar graph with asp.net MVC 3. We can download the plugin for the below location-

http://www.jqplot.com/

To start with let’s see how bar graph works. Following is code for a bar graph with HTML and JavaScript bar data object-
<link class="include" rel="stylesheet" type="text/css" href="@Url.Content("~/scripts/jqplot/css/jquery.jqplot.min.css")" />
<!--[if lt IE 9]><script language="javascript" type="text/javascript" src="@Url.Content("~/scripts/jqplot/excanvas.min.js")"></script><![endif]-->
<script type="text/javascript" src="@Url.Content("~/scripts/jqPlot/jquery.jqplot.min.js")"></script>
@*<script type="text/javascript" src="@Url.Content("~/scripts/jqplot/jqplot.canvasTextRenderer.min.js")"></script>
<script type="text/javascript" src="@Url.Content("~/scripts/jqplot/jqplot.canvasAxisTickRenderer.min.js")"></script>*@
<script type="text/javascript" src="@Url.Content("~/scripts/jqplot/jqplot.categoryAxisRenderer.min.js")"></script>
<script type="text/javascript" src="@Url.Content("~/scripts/jqPlot/jqplot.barRenderer.min.js")"></script>

<div class="example-content">
    <!-- Example scripts go here -->
    <style type="text/css">
        .jqplot-target
        {
            margin: 30px;
        }
        .tooltipCss
        {
            position: absolute;
            background-color: #b2b1ac;
            color: White;
            z-index: 200;
            padding: 5px;
            border-radius: 5px;
            display: none;
        }
    </style>
    <div id="chart2" class="plot" style="width: 760px; height: 360px;">
    </div>
</div>
<script language="javascript" type="text/javascript">
    $(document).ready(function () {
        pop1980 = [4, 5, 3, 6, 5, 4, 2, 5];
        pop1990 = [3, 5, 6, 2, 4, 3, 4, 6];
        pop2000 = [2, 5, 6, 3, 4, 5, 2, 4];
        pop2008 = [5, 3, 4, 2, 6, 5, 2, 4];

        ticks = [5, 6, 7, 8, 9, 10, 11, 12];

        series = [
                  { label: 'r. DMR Published - Singapore' },
                  { label: 's. DMR Published - London' },
                  { label: 't. DMR Published - Houston' },
                  { label: 'u. DMR Published - Global' }
               ];

        plot2 = $.jqplot('chart2', [pop1980, pop1990, pop2000, pop2008], {
            legend: {
                show: true,
                placement: 'outsideGrid'
            },
            seriesDefaults: {
                renderer: $.jqplot.BarRenderer,
                rendererOptions: {
                    barPadding: 5
                }
            },
            series: series,
            axes: {
                xaxis: {
                    renderer: $.jqplot.CategoryAxisRenderer,
                    ticks: ticks
//                    ,
//                    tickRenderer: $.jqplot.CanvasAxisTickRenderer,
//                    tickOptions: {
//                        angle: -15
//                    }
                }
            }
        });
        $('#chart2').bind('jqplotDataMouseOver',
            function (ev, seriesIndex, pointIndex, data) {
                $('#info2').html('series "' + series[seriesIndex].label + '" point "' + (pointIndex + 5) + '"<br /> value "' + data[1] + '"');
                $('#info2').css({ "left": ev.pageX + 3, "top": ev.pageY })
                $('#info2').show();
            }
        );
        $('#chart2').bind('jqplotDataUnhighlight',
            function (ev) {
                $('#info2').hide();
            }
        );
    });
</script>
<div id="info2" class="tooltipCss">
</div>
If you check the file references, you can check a file named excanvas.min.js. This is the file for internet explorer less than 9. As the bar is rendered in canvas, a HTML 5 feature, which is not supported in lower versions of IE. All other files are required for bar graph. If you notice, you can see there are two files that are commented out (jqplot.canvasTextRenderer.min.js and jqplot.canvasAxisTickRenderer.min.js ). These two files are needed if you want to rotate the tick texts in both the axis. In the bar initialization you can find the corresponding tickRenderer code is commented out for x-axis. Div with id chart2 is used to hold the bar graph. And div with id info2 is used to hold tooltip content. Input to the graph is array of arrays where each inner array represents data for each bar.

Number of items in each inner array is same. Other than this array there are two more arrays used. One is ticks, this is used to represent the data interval in x- axis. And another is series, this array is used to represent the name of each bar. The order of the series item should be same as the order of the data input arrays.

There are many options used in the plugin. Detail of various options can be found here-

http://www.jqplot.com/docs/files/jqPlotOptions-txt.html
http://www.jqplot.com/docs/files/optionsTutorial-txt.html

We can use as many options required in this case.

Other than these we are using two more events in the plugin named 'jqplotDataMouseOver' and 'jqplotDataUnhighlight'. We are using these events to track tooltips in each bar. We can add debugger and check what is happening.

Model driven Bar Graph:

To make the graph model driven we can have the following model-
namespace Bar.Models
{
    public class BarViewModel
    {
        public int Id { get; set; }
        public string BarName { get; set; }
        public int[] Values { get; set; }
    }
    public class BarDataViewModel
    {
        public int[] TickValues { get; set; }
        public List<BarViewModel> Data { get; set; }
    }
}
And in the controller action we are creating the data in memory as –
        public ActionResult ModelDrivenBar()
        {
            BarDataViewModel data = new BarDataViewModel();
            data.Data = new List<BarViewModel>();
            BarViewModel bar;
            Random r=new Random();
            for (int i = 0; i < 4; i++)
            {
                bar = new BarViewModel();
                bar.Id = i;
                bar.BarName = "Bar Name " + i.ToString();
                bar.Values = new int[10];
                for (int j = 0; j < 10; j++)
                    bar.Values[j] = r.Next(2, 6);
                data.Data.Add(bar);
            }
            data.TickValues = new int[10];
            for (int i = 5; i < 15; i++)
                data.TickValues[i - 5] = i;
            return View(data);
        }
We need to do two changes in the view to accommodate the changes. First add the following line at the starting of the view-
@model Bar.Models.BarDataViewModel
And secondly generate the three arrays, as we have discussed earlier, like below-
        var data = new Array();
        var ticks = new Array();
        var series = new Array();
        @foreach (var d in Model.TickValues)
        {
            <text>ticks.push(</text>@d<text>);</text>
        }
        @foreach (var d in Model.Data)
        {
            <text>var bar</text>@d.Id<text>= new Array();</text>
            <text>series.push({label : "</text>@d.BarName<text>"});</text>
            foreach (var darray in d.Values)
            { 
                <text>bar</text>@d.Id<text>.push(</text>@darray<text>);</text>
            }
            <text>data.push(bar</text>@d.Id<text>);</text>
        }
        plot2 = $.jqplot('chart2', data, {
Instead of explaining the code above, we can check the output of the code below-
        var data = new Array();
        var ticks = new Array();
        var series = new Array();
            ticks.push(5);
            ticks.push(6);
            ticks.push(7);
            ticks.push(8);
            ticks.push(9);
            ticks.push(10);
            ticks.push(11);
            ticks.push(12);
            ticks.push(13);
            ticks.push(14);
            var bar0= new Array();
            series.push({label : "Bar Name 0"});
                bar0.push(2);
                bar0.push(4);
                bar0.push(5);
                bar0.push(5);
                bar0.push(4);
                bar0.push(3);
                bar0.push(2);
                bar0.push(2);
                bar0.push(3);
                bar0.push(5);
            data.push(bar0);
            var bar1= new Array();
            series.push({label : "Bar Name 1"});
                bar1.push(4);
                bar1.push(2);
                bar1.push(2);
                bar1.push(5);
                bar1.push(2);
                bar1.push(3);
                bar1.push(4);
                bar1.push(5);
                bar1.push(5);
                bar1.push(2);
            data.push(bar1);
            var bar2= new Array();
            series.push({label : "Bar Name 2"});
                bar2.push(4);
                bar2.push(3);
                bar2.push(3);
                bar2.push(4);
                bar2.push(2);
                bar2.push(2);
                bar2.push(2);
                bar2.push(3);
                bar2.push(4);
                bar2.push(5);
            data.push(bar2);
            var bar3= new Array();
            series.push({label : "Bar Name 3"});
                bar3.push(5);
                bar3.push(4);
                bar3.push(5);
                bar3.push(2);
                bar3.push(4);
                bar3.push(3);
                bar3.push(5);
                bar3.push(4);
                bar3.push(3);
                bar3.push(5);
            data.push(bar3);
        plot2 = $.jqplot('chart2', data, {
What we are doing here is just creating the bar data dynamically by looping the model data.

Ajax Bar Graph:

To make it ajax driven we can simply change the controller return type like below-
        public JsonResult AjaxBarData()
        {
            //same code like earlier
            return Json(data,JsonRequestBehavior.AllowGet);
        }
And we can do an ajax call to the controller and in the success of the ajax call we can initialize the graph-
<script type="text/javascript">
    $(document).ready(function () {
        $.ajax({
            type: "get",
            timeout: 30000,
            url: '@Url.Action("AjaxBarData")',
            dataType: "json",
            contentType: "application/json; charset=utf-8",
            success: function (result) {
                var data = new Array();
                var ticks = new Array();
                var series = new Array();
                $(result.TickValues).each(function (i, itm) {
                    ticks.push(itm);
                });
                $(result.Data).each(function (i, itm) {
                    series.push({ label: itm.BarName });
                    data[i] = new Array();
                    $(itm.Values).each(function (j, item) {
                        data[i].push(item);
                    });
                });
  //initialize the bar graph here
                plot2 = $.jqplot('chart2', data, {
            },
            error: function (req, status, error) {
                debugger;
            }
        });
    });
</script>
That’s all. You can download the bar code here.