Tuesday, December 11, 2012

Run some VBA code when excel opens

This is a very simple post describes how to run some code when excel opens.

Excel always runs a subroutine named Auto_Open() when excel opens. Simple we can use this subroutine to do the job.

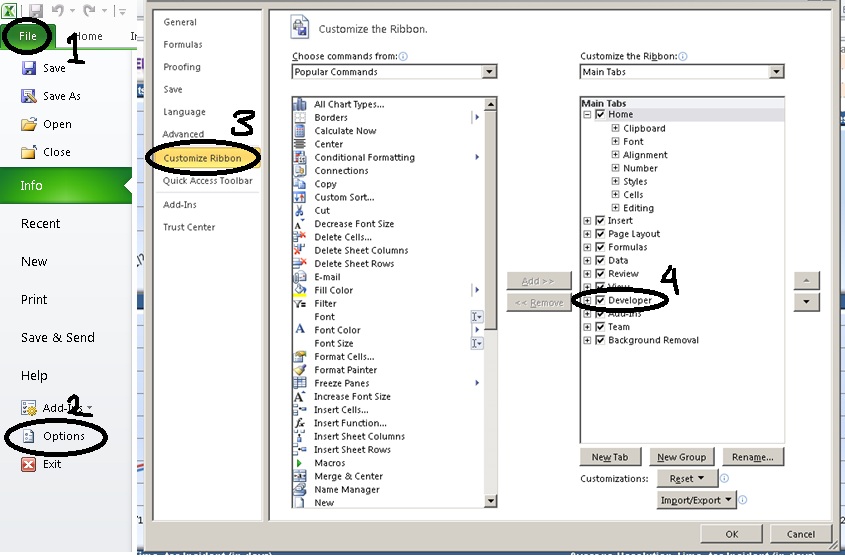
Go to developer tab then click visual basic button. If you cannot locate developer tool then you can enable developer tab by looking into the image below-


After enabling go to developer tab and then click on visual basic button. This will open visual basic editor.


Paste the following code and save the excel file. Close the file and open again. You can see the alert message as soon as the file opens-
Sub Auto_Open()
    MsgBox "The file is open now"
End Sub
Download the sample excel 2010 file here.

Monday, November 26, 2012

Asp.net validation add text background color

Following is code for adding background color to the text box if validation fails in asp.net web form-

<html xmlns="http://www.w3.org/1999/xhtml">
<head runat="server">
    <title></title>
</head>
<body>
    <form id="form1" runat="server">
    <asp:TextBox ID="txtOne" runat="server" />
      <asp:RequiredFieldValidator ID="rfv" runat="server" 
                                 ControlToValidate="txtOne" Text="" />
      <asp:TextBox ID="txtTwo" runat="server" />
      <asp:RequiredFieldValidator ID="rfv2" runat="server" 
                                 ControlToValidate="txtTwo" Text="" />
      <asp:Button ID="btnOne" runat="server" OnClientClick="return BtnClick();" 
                                         Text="Click" CausesValidation="true" />
   <script type="text/javascript">
       function BtnClick() {
            var val = Page_ClientValidate();
            if (!val) {
                var i = 0;
                for (; i < Page_Validators.length; i++) {
                    if (!Page_Validators[i].isvalid) {
                        $("#" + Page_Validators[i].controltovalidate)
                         .css("background-color", "red");
                    }
                }
            }
            return val;
        }
    </script>
    </form>
</body>
</html>


Wednesday, November 7, 2012

Export PDF using jQuery and generic handler in asp.net

Recently I have added a post regarding Export HTML to excel using jQuery and asp.net. Here I am repeating the same for PDF. I will suggest you to go through the previous post as I am not explaining repeating technical aspects.

Let’s directly check the following HTML code-
<html xmlns="http://www.w3.org/1999/xhtml">
<head runat="server">
<script src="http://ajax.aspnetcdn.com/ajax/jQuery/jquery-1.7.js" type="text/javascript"></script>
<script type="text/javascript">
    $(document).ready(function() { 
        $(".expPDF").click(function(){
            var someDummyParameter="test";
            $('body').prepend("<form method='post' action='GetPDF.ashx' style='top:-3333333333px;' id='tempForm'><input type='hidden' name='data' value='" + someDummyParameter + "' ></form>");
            $('#tempForm').submit();
            $("tempForm").remove();
        });
    });
</script>
</head>
<body>
    <form id="form1" runat="server">
    <a href="#" target="_blank" class="expPDF">Export to pdf</a>
    </form>
</body>
</html>
The above code is simple. We are having a simple anchor(a) as a button to lunch the PDF. On the click of the anchor we are creating a form tag on the fly, assigning the action to a generic handler that will create the PDF file. At the end we are submitting the form. On the form submit the form will get posted to generic handler. In this example we are also passing some dummy data as hidden filed which will be accessible in the handler code. Likewise we need some additional information we can pass form elements.

Now let’s define the handler code. In the handler we can create the PDF file using some library like itextsharp or something similar. But in this example we are just reading PDF file from the memory the memory. Code is like this-
<%@ WebHandler Language="C#" Class="GetPDF" %>

using System;
using System.Web;

public class GetPDF : IHttpHandler {
    
    public void ProcessRequest (HttpContext context) {
                
        string inputData = context.Request.Form["data"];
        
        byte[] buffer;
        using (System.IO.FileStream fileStream = new System.IO.FileStream(@"E:\ForumPosts\jQueryPDF\" + inputData + ".pdf", System.IO.FileMode.Open, System.IO.FileAccess.Read, System.IO.FileShare.Read))
        using (System.IO.BinaryReader reader = new System.IO.BinaryReader(fileStream))
        {
            buffer = reader.ReadBytes((int)reader.BaseStream.Length);
        }
        context.Response.ContentType = "application/pdf";
        context.Response.AddHeader("Content-Length", buffer.Length.ToString());
        context.Response.AppendHeader("content-disposition", "inline; filename=test.pdf"); 
        context.Response.BinaryWrite(buffer);
        context.Response.End(); 
    }
 
    public bool IsReusable {
        get {
            return false;
        }
    }

}
As you can see the first line in the handler ProcessRequest function we are accessing the form data passed string inputData = context.Request.Form["data"];. The remaining code is self-explanatory. The PDF file path I have hard coded according to my folder structure.

You can download the code form here.

Tuesday, October 30, 2012

Export HTML to excel using jQuery and asp.net

Here we will see how to export a HTML table content to excel using asp.net web form and C# using jQuery.

Let’s start with a small piece of code –
    <h2>
        Export to excel using jquery
    </h2>

    <a href="#" class="expToExcel">Export to excel</a>
    <div id="toReport">
    <table>
        <tr>
          <th>Name</th>
          <th>Age</th>
          <th>Email</th>
        </tr>
        <tr>
          <td>John</td>
          <td>44</td>
          <td>john@gmail.com</td>
        </tr>
        <tr>
          <td>Rambo</td>
          <td>33</td>
          <td>rambo@gmail.com</td>
        </tr>
        <tr>
          <td>It's hot</td>
          <td>33</td>
          <td>test@hotmail.com</td>
        </tr>
    </table>
    </div>
On click of "Export to excel" let do export the content to excel file using jQuery. We can do this in following steps-
  1. Get the HTML content.
  2. Encode the HTML content.
  3. Pass the HTML encoded content to an aspx page.
  4. Generate the excel file from code behind.
Step 1-
var data = $("#toReport").html();
data = escape(data);
Why we are escaping the HTML data and then passing to code behind. Answer is that we are going to pass the data to an aspx page using a dynamically created form. It is going to through "A potentially dangerous Request.Form value was detected from the client" error. That’s why we are escaping the HTML content.

Step 2-
$('body').prepend("<form method='post' action='exportPage.aspx' style='top:-3333333333px;' id='tempForm'><input type='hidden' name='data' value='" + data + "' ></form>");
$('#tempForm').submit();
$("tempForm").remove();
In this step we are adding an aspx page named exportPage.aspx. And creating a form tag on the fly, add the HTML data to a hidden field and submit the form using jQuery. And finally remove the added form tag.

Step 3 & 4-
        string data = Request.Form["data"];
        data = HttpUtility.UrlDecode(data);
        Response.Clear();
        Response.AddHeader("content-disposition", "attachment;filename=report.xls");
        Response.Charset = "";
        Response.ContentType = "application/excel";
        HttpContext.Current.Response.Write( data );
        HttpContext.Current.Response.Flush();
        HttpContext.Current.Response.End();
In this step we are simply creating the excel file and flushing the result as excel. You may see a message saying corrupt excel file do you want to open the file. You can open the file not an issue. I am too lazy to fine out proper setting.

You can also download the code from here.

Wednesday, October 3, 2012

Progress bar for long running process with steps using asp.net, C#, SignalR

I have come across with many questions regarding implementing progress of some long running operations in asp.net application. And I could not see any way to solve this problem directly in asp.net. Even with ajax call to get what step is running is not possible because once a long process has started, the server cannot listen to an ajax request until the previous step is finished. This is because the processing is done as a single thread.

Thanks to Microsoft for VS 2010 and SignalR.

Here we will try to implement a demo progress of long running application step by step using SignalR and visual studio 2010.

Step 1- Install signal R
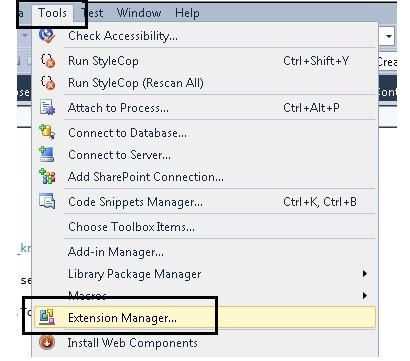
Check whether NuGet package manager is installed with your visual studio. If not go to tool -> Extension manager this will pop up the following window-


Go to online gallery, if you cannot see NuGet Package Manager, then search on the search box on the left side. Install it.

Create a web application with dot net framework 4, and then right click on the project and then click on Manage NuGet Packages… This will pop up the above window again like below-


Go to online then type signalr in the search box. This will list SignalR as the first item. Click on install.

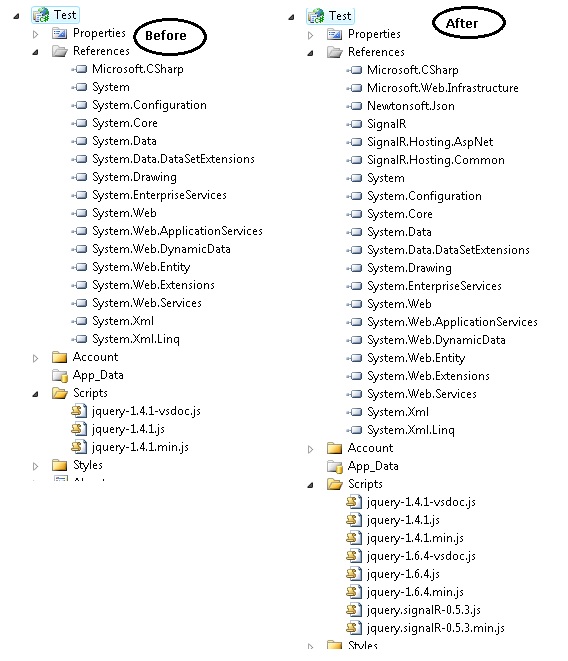
If you note down the reference of your project and the js file you can see the following difference-


Step 2-
First we will create a class named ServerComplexObjectand inherit this from SignalR.Hubs.Hub. And we will add a method named ComplexProcess() like below-
    public class ServerComplexObject:SignalR.Hubs.Hub {
        public void ComplexProcess()
        {
            System.Threading.Thread.Sleep(2000);
            Clients.AddProgress("Step 1 of 5 has completed.");
            System.Threading.Thread.Sleep(2000);
            Clients.AddProgress("Step 2 of 5 has completed.");
            System.Threading.Thread.Sleep(3000);
            Clients.AddProgress("Step 3  of 5 has completed.");
            System.Threading.Thread.Sleep(1000);
            Clients.AddProgress("Step 4 of 5 has completed.");
            System.Threading.Thread.Sleep(4000);
            Clients.AddProgress("Step 5 of 5 has completed.",true);
        }
    }
We have just used Sleep method of thread to simulate long running process. Here Clients is a dynamic property of Hub which represents all clients connected to the Hub. And AddProgress is a dynamic expression that will get invoked by the server. And a JavaScript method with exactly same name should be present in the client side.

Step 3-
Now to call this we have to take the reference of the appropriate JavaScript files and this are-
    <script src="Scripts/jquery-1.6.4.js" type="text/javascript"></script>
    <script src="Scripts/jquery.signalR-0.5.3.js" type="text/javascript"></script>
    <script src="signalr/hubs" type="text/javascript"></script>
Now we will have the following HTML-
    <div class="prgressBar" style="width:300px; padding-top:32px">
        <div class="bar" ></div>
    </div>
    <input id="btn" value="start process" type="button" />
In this first di is used to show the progress bar and the second button is used to start the process.

Step 4-
Now we have to do 4 steps to do the sample working-
  1. Create a proxy of the server object.
  2. Add a method with the same name "AddProgress".
  3. Start the hub for listening.
  4. And finally start the complex process from client.
And the code goes like below-
   <script type="text/javascript">
        var img = new Image();
        img.src = "https://cms.unov.org/FullTextSearch/Common/Images/progress.gif";
        $(document).ready(function () {
            var myConnection = $.connection.serverComplexObject;
            myConnection.AddProgress = function (message, completed) {
                $(".prgressBar .bar").html(message);
                if (completed) {
                    $(".prgressBar").removeClass("rotating");
                    $(".prgressBar .bar").html("process completed");
                }
            }
            $("#btn").click(function () {
                $(".prgressBar").addClass("rotating");
                myConnection.complexProcess();
            });
            $.connection.hub.start();
        });
    </script>
Let me list the above steps again
  1. Create a proxy of the server object.(var myConnection = $.connection.serverComplexObject;)
  2. Add a method with the same name "AddProgress".(myConnection.AddProgress = function (message, completed) {)
  3. Start the hub for listening.($.connection.hub.start();)
  4. And finally start the complex process from client.(myConnection.complexProcess();)
Now one thing you can note that serverComplexObject is same as the class name with first letter lowercased. Same is with complexProcess server method. That’s done. You can download the code to see the process in action.

Wednesday, September 26, 2012

To display the webpage again, the web browser needs to resend the information you’ve previously submitted.

To display the webpage again, Internet Explorer needs to resend the information you've previously submitted.
If you were making a purchase, you should click Cancel to avoid a duplicate transaction. Otherwise, click Retry to display the webpage again.


or

To display the webpage again, the web browser needs to resend the information you've previously submitted.
If you were making a purchase, you should click Cancel to avoid a duplicate transaction. Otherwise, click Retry to display the webpage again.


I was getting this a popup window in IE while working on an application and spent some time to resolve this issue. One page of my application was configured to reload information from server every three minutes. And there should not be any human interactions to the page as the page will a running one in a bug TV. But I was getting the above popup. One either has to click ok or cancel to proceed.

On little investigation I found that I was using window.location.reload() for reloading the page.

The answer is as follows-

The reload() method in IE is actually a post method and IE is showing this popup to avoid loss or resend of the information to the server. An easy solution is to replace this post with a get and it done with the following line-
window.location = window.location;

JavaScript date time localization e.g. central time to other time zone

Recently I had a requirement of doing JavaScript time localization. Problem statement goes like this-

"We have some data in central time (CST) in database. This data is basically a Gantt chart data. The database date time entry is there as CST because of the business lies in that region and there are many other business requirements. This data is presented as Gantt chart in web and people from many countries can see the chart and each one should see the data in their own localized time."

I have searched in web and could not get a direct content to the problem. So, thought to share the approach I have followed. We can solve this problem by following steps-
  1. Convert the source time to UTC time.
  2. And convert the UTC time to destination time.
Now for we need to be careful that whether the time zone has daylight-saving. As stated previously our source data in CST which is -06:00(offset) hours compared to UTC. In case of daylight saving its -05:00 hours. Let’s take a time 09/24/2012 14:00:00, this is a CST time. In this case the date falls under daylight-saving.

Now we need to get two things about the source system: - first- Date offset and second- is daylight-saving. As my IIS where the application is hosted is in CST time zone, we can get this information from application start event. Here I have decided to write the information to an xml file in the following format-
<TimeLocalization>
    <TimeOffset>-6.0</TimeOffset>
    <IsDayLight>True</IsDayLight>
</TimeLocalization>
So, in the Application_Start we can get this information.
XmlTextWriter myXmlWriterTime = new XmlTextWriter("file path", null);
myXmlWriterTime.Formatting = Formatting.Indented;
myXmlWriterTime.Indentation = 4;
myXmlWriterTime.WriteStartElement(Constants.TimeLocalization);
myXmlWriterTime.WriteElementString(Constants.TimeOffset, (DateTime.Now- DateTime.UtcNow).TotalHours.ToString());
myXmlWriterTime.WriteElementString(Constants.IsDayLight,DateTime.Now.IsDaylightSavingTime().ToString());
myXmlWriterTime.WriteEndElement();
myXmlWriterTime.Close();
In case of time offset it will always return -6.0 for CST now if the daylight-saving is true we need to add 1 resulting -5.0.

In the page load of the page where I am showing the Gantt chart, just doing a synchronous ajax call to read the value in JavaScript object like below-
$.ajax({
    type: "GET",
    url: "TimeOffset.xml",
    dataType: "xml",
    async: false,
    success: function (xml) {
        document.TimeOffset = parseFloat($(xml).find('TimeOffset').text());
        if ($(xml).find('IsDayLight').text() == "True")
            document.TimeOffset = document.TimeOffset + 1;
    },
    error: function () {
        alert("An error occurred while processing XML file.");
    }
});
Here it’s a specific case of CST. I have not tested where there is any time zone that needs a subtraction by 1.

I have created a function that will take a CST time and it will convert it to any time. In my case I am running the function from Indian time zone IST (+05:30). It goes like-
var cstArr;
function ConvertCSTTolocal(dateString) {
    //09/24/2012 14:00:00 CST
    debugger;
    cstArr = dateString.split(" ")[0].split("/");
    cstArr.push(dateString.split(" ")[1].split(":"))
    tmpDate = new Date(cstArr[2], parseInt(cstArr[0], 10) - 1, cstArr[1], cstArr[3][0], cstArr[3][1], cstArr[3][2]);
    tmpDate.setMinutes(tmpDate.getMinutes() - parseFloat(document.TimeOffset) * 60);

    tmpDate = tmpDate.toString().split(" ");
    tmpDate = tmpDate[0] + ", " + tmpDate[2] + " " + tmpDate[1] + " " + tmpDate[5] + " " + tmpDate[3] + " UTC";
    return new Date(tmpDate);
}
Now lets pass the input date to the function and see how the function goes. Our input is 09/24/2012 14:00:00 in CST. Lets investigate step by step-

Step1-
cstArr = dateString.split(" ")[0].split("/"); cstArr.push(dateString.split(" ")[1].split(":"))

With these lines we are simply splitting the date string in year, month, day, hours, minutes, and seconds. And it looks like-


Step2-
tmpDate = new Date(cstArr[2], parseInt(cstArr[0], 10) - 1, cstArr[1], cstArr[3][0], cstArr[3][1], cstArr[3][2]);

With these lines we are just passing the values to JavaScript Date function to create a date object. As I am in IST (+05:30) the resulting date is not the date as I have passed as input-


If you check the above date you can see it the same date and time as I have passed but UTC+05:30 is appended. Which means it’s the same time but in Indian time. If we convert this time to CST it will not be the same as passed input. But that’s not our intention. Our intention is to create a date and just add the offset to get the modified date and time.

Step3-
tmpDate.setMinutes(tmpDate.getMinutes() - parseFloat(document.TimeOffset) * 60);

With this line we are just negating the time zone offset of the central time (CST) to get the new time. Is it really giving the UTC time? Answer is no as explained earlier.

Step 4-


In the above image we can see the added time which is correct time with wrong offset. If we convert the input time 09/24/2012 14:00:00 to UTC, it will be 09/24/2012 19:00:00 in UTC time ( +5) considering daylight-saving. So, the problem is with the offset. If we see the UTC equivalent of the time using toUTCString method then we can see the UTC representation is coming like "day, date month year hour:min:sec UTC".

Step 5-
As the data are same except the time offset, we can prepare a UTC equivalent string from tmpDate like below-

tmpDate = tmpDate[0] + ", " + tmpDate[2] + " " + tmpDate[1] + " " + tmpDate[5] + " " + tmpDate[3] + " UTC";

this results the following-


This is the correct UTC value. Now if we pass this UTC string to a Date() function, it will result correct value for the current time zone. For example if we run this code in IST it will result the following-


Which is exactly the same value of we convert 09/24/2012 14:00:00 CST time to IST.

That’s it, problem solved.

Friday, September 14, 2012

Run a JavaScript function after asp.net client side validation is successful

There are some scenarios where we need to call some JavaScript code after the client side validation is successful and before the page is post back. We can do it easily. In asp.net while client validation it assigns a JavaScript variable Page_IsValid. If the validation is successful then it assign true else assign false. So we can trap the value of the variable to do your code execution. Hence let’s have the following code-
<html xmlns="http://www.w3.org/1999/xhtml">
<head runat="server">
    <title>Untitled Page</title>

    <script src="scripts/jquery.js" type="text/javascript"></script>
    <script type="text/javascript">
    function call(){
         if(Page_IsValid)
         {
            alert("alert page is value");
         }    
    }
    </script>
</head>
<body>
    <form id="form1" runat="server">
    <div>
        <asp:RequiredFieldValidator ID="RequiredFieldValidator1" runat="server" ErrorMessage="Required"
            ControlToValidate="TextBox1"></asp:RequiredFieldValidator>
        <asp:TextBox ID="TextBox1" runat="server"></asp:TextBox>
        <asp:Button ID="Button1" runat="server" Text="Button" OnClientClick="call();" />
    </div>
    </form>
</body>
</html>
But this code will not work. Reason is that the client click gets called before the page validation. We can solve this by two ways-

First-

In the above code we can explicitly call the client validation code. To do this we will just modify the call() JavaScript function like below-
    function call(){
        Page_ClientValidate();
         if(Page_IsValid)
         {
            alert("alert page is value");
         }    
    }
Here Page_ClientValidation() is explicitly calling the client validation. After this function is executed the value of Page_IsValid will get set to true /false. So, we are checking whether client validation is successful. If so call the alert method. We can replace this with our desired code.

Second-

After the client validation is done container form submit event is fired. We can trap the JavaScript submit event and do the same logic. For that let’s remove the OnClientClick from the button and then have the following JavaScript code-
    <script src="scripts/jquery.js" type="text/javascript"></script>
    <script type="text/javascript">
    $(document).ready(function(){
        $("#Button1").closest("form").submit(function(){
            if(Page_IsValid)
             {
                alert("alert page is value");
             }    
        });
    });
    </script>
And it’s done.

Monday, September 3, 2012

Radio button list with knockout.js

Below is a quick example of radio button list with knockout.js-
<script src="http://knockoutjs.com/js/knockout-2.1.0.js" type="text/javascript"></script>

<table>
    <tr>
        <td>
            <div data-bind="foreach: items">
                <input type="radio" name="items" data-bind="attr: { value: id }, checked: $root.selected" />
                <span data-bind="text: name"></span>
            </div>
            <div data-bind="text: selected">
            </div>
        </td>
    </tr>
</table>
<script type="text/javascript">
    function RadioButton(id, name, selected) {
        this.id = id;
        this.name = name;
        this.selected = selected;
    }
    function RadioModel() {
        var self=this;
        self.items= [
            new RadioButton(1, "first", true),
            new RadioButton(2, "two", false),
            new RadioButton(3, "three", false),
        ];
        self.selected = ko.observable();
        self.onSubmit= function () {
            var x = self.selected();
        }
    };
    var viewModel = new RadioModel();
    $(function () {
        ko.applyBindings(viewModel);
        var selected = ko.utils.arrayFirst(viewModel.items, function (item) { return item.selected; });
        viewModel.selected(selected.id);
    });
</script> 
We can check this in jsFiddle here.

Sunday, September 2, 2012

Check whether a function is registered or not to an event in JavaScript

This is a small and simple post to check whether a JavaScript function is registered to an event of a DOM element. For this example we will take a button and click event. We will associate two functions and then will check whether one a function is attached or not.

We will do this using getAttribute method of a DOM element to get the value of onclick attribute. Code goes like below-
<html xmlns="http://www.w3.org/1999/xhtml">
<head>
  <script type="text/javascript">
       function handlerFunction1() {
          alert("1");
      }
      function handlerFunction2() {
          alert("2");
      }
      function fn() {
           var functionArray = document.getElementById("test").getAttribute("onclick").split(",");
     for(var i=0; i<functionArray.length; i++)
     {
    if(functionArray[i].indexOf("handlerFunction1()")>=0)
     alert("function fn1() is registered with click me function");
     }
      }

  </script>
<title>
 </title></head>
<body>
    <form method="post" action="about show error message.aspx" id="form1">
    <input onclick="handlerFunction1(), handlerFunction2()" value="click me" type="button" id="test" />
    <a onclick="fn()" href="#">check fn1() is registered with click button</a>
    </form>
</body>
</html>
Now what if the event handlers are added dynamically with addEventListener/attachEvent, in that case the value of document.getElementById("test").getAttribute("onclick") will be null even if there are two functions registered to the event.

That reminds me some attribute or function like eventListenerList. But most of the browser does not support this now. It’s still a recommendation; you can check this here-

http://www.w3.org/TR/2001/WD-DOM-Level-3-Events-20010823/events.html#Events-EventListenerList

But we can implement something like below-
<html xmlns="http://www.w3.org/1999/xhtml">
<head>
  <script type="text/javascript">
       function handlerFunction1() {
          alert("1");
      }
      function handlerFunction2() {
          alert("2");
      }
      function fn() {
           var functionArray = document.getElementById("test").getAttribute("onclick");
     if(functionArray!=null)
    functionArray=functionArray.split(",");
     else
     {
    if(document.getElementById("test").eventListenerList!=null)
    functionArray= document.getElementById("test").eventListenerList["click"];
     }
     
     for(var i=0; i<functionArray.length; i++)
     {
    if(functionArray[i].indexOf("handlerFunction1()")>=0)
     alert("function fn1() is registered with click me function");
     }
      }
   function addEventHandler(elem,eventType,handler) {
  if(elem.eventListenerList==null)
   elem.eventListenerList=new Object();
  if(elem.eventListenerList[eventType]==null)
   elem.eventListenerList[eventType]=new Array();
  elem.eventListenerList[eventType].push(handler);
   if (elem.addEventListener)
    elem.addEventListener (eventType,handler,false);
   else if (elem.attachEvent)
    elem.attachEvent ('on'+eventType,handler); 
   }
   window.onload=function(){
  var btn= document.getElementById("test");
  addEventHandler(btn,"click",handlerFunction1);
  addEventHandler(btn,"click",handlerFunction2);
   }
  </script>
<title>
 </title></head>
<body>
    <form method="post" action="about show error message.aspx" id="form1">
    <input value="click me" type="button" id="test" />
    <a onclick="fn()" href="#">check fn1() is registered with click button</a>
    </form>
</body>
</html>
Following is a running snap shot.

Friday, August 10, 2012

Master-detail with knockout in asp.net MVC 3

In this post we will be discussing creating a master detail relationship with Knockout.js in asp.net MVC 3. For this let’s take a simple view model like below-
    public class PersonViewModel
    {
        public int PersonID { get; set; }
        public string FirstName { get; set; }
        public string LastName { get; set; }
        public string Sex { get; set; }
        public int Age { get; set; }
        public string Address { get; set; }
    }
How we will be starting the problem is that, we will be retrieving a list of person with id, and name only and present the data in a HTML table. And on click of the table row we will be showing detail of the person with the additional information.

If we are not aware of knockout we can here and download and study the it.

For this example we will be using the following controller method to retrieve some in memory data-
public ActionResult Index()
{
    List<PersonViewModel> data = new List<PersonViewModel>();
    for (int i = 0; i < 10; i++)
        data.Add(new PersonViewModel() {PersonID=i, FirstName = "First Name " + i.ToString(), LastName = "Last Name " + i.ToString() });
    return View(data);
}
Next step is to prepare UI for the problem. First we will take the reference of jQuery and knockout file like below-
<script src="@Url.Content("~/Scripts/jquery-1.4.4.min.js")" type="text/javascript"></script>
<script src="http://knockoutjs.com/js/knockout-2.1.0.js" type="text/javascript"></script>
And we will be using the following HTML for displaying the person list and the detail-
<table>
    <tr><th>First Name</th><th>Last Name</th></tr>
    <tbody >
    <tr id="PersonID" style="cursor:pointer" >@*repeat the row to display all the person*@
        <td >First name of the person</td>
        <td >Last name of the person</td>
    </tr>
    </tbody>
</table>
<p data-bind="with: personViewModel.selectedItem">
    <b>Name:</b> <span >First name of the person</span> &nbsp;<span >Last name of the person</span><br />
    <b>Age:</b> <span >Age of the person</span> <br />
    <b>Sex:</b> <span >Sex of the person</span> <br />
    <b>Address:</b> <span >Address of the person</span> <br />
</p>
As you can see that the controller method is returning List<PersonModelView> as the type of the strongly type view, so, we will have the following model directive in the view-
@model List<KnockoutMasterDetail.Models.PersonViewModel>
This will give generic list of Person data. But as per out requirement of knockout we need to convert this list to JavaScript array. We can do this by the following code-
var persons = new Array();
@foreach (var d in Model)
{
    <text>persons.push({PersonID:</text>@d.PersonID<text>, FirstName:"</text>@d.FirstName<text>", LastName:"</text>@d.LastName<text>"});</text>
}
The above code will be inside the script tag in the view. And it’s simply looping the person list and creating an array of person object like {PersonID:1, FirstName:”First Name 1”, LastName:”Last name 1” }. Now we have our person array ready. Next let’s create view model to be used with knockout.
function personModel() {
    var self = this;
    self.persons = ko.observableArray(persons);
    self.selectedItem = ko.observable();
    self.getDetail = function(item) { 
      //to be implemented  
    }
}
personViewModel = new personModel();
In the above JavaScript function, we are adding this line self.persons = ko.observableArray(persons);. What it means is that we are directing the knockout that the persons array is an observable. That mean if there is any change in the array then its corresponding UI will also be changed automatically. For this example, if we do not make the array as observable, it will work as we are not expecting any change in the array. So, we can simply have self.persons = persons;. But we need the next statement, as on clicking a row we need to change the detail. To activate the viewmodel to work with knockout, we need to register the viewmodel. We can do this by the following like-
ko.applyBindings(personViewModel);
Just this registration will not work. We need to make the necessary changes in the HTML.

Now self.persons is an array and we need to make changes in the HTML table to link this array to the HTML table. We can do this by following-
    <tbody data-bind="foreach: personViewModel.persons">
    <tr data-bind="click:personViewModel.getDetail, attr: {id: PersonID}" style="cursor:pointer" >
        <td data-bind="text: FirstName"></td>
        <td data-bind="text: LastName"></td>
    </tr>
    </tbody>
What we are doing here is adding data-bind attribute that is related to knockout. Whenever we will make any change in the array, knockout will use this attribute to make changes back to the UI. In the first line we are using foreach to loop through all the items of the array persons and putting the values of the array item to row. Next line we have click:personViewModel.getDetail, attr: {id: PersonID}. In first part of it we are associating click event of the row to a function in the viewmodel named getDetail. In the second part we are assigning id of the row to PersonID. And in the remaining two lines we are assigning first name and last name to two cells.

Next we need to modify the detail section and we need to associate this to observable selectedItem in the model and we can do this by altering the HTML as below-
<p data-bind="with: personViewModel.selectedItem">
    <b>Name:</b> <span data-bind="text: FirstName"></span> &nbsp;<span data-bind="text: LastName"></span><br />
    <b>Age:</b> <span data-bind="text: Age"></span> <br />
    <b>Sex:</b> <span data-bind="text: Sex"></span> <br />
    <b>Address:</b> <span data-bind="text: Address"></span> <br />
</p>
So, now whenever we will click the row it will call the function getDetail in the model. Currently the function is empty. Let’s first have a controller method that returns the detail of the person like below-
        public JsonResult GetDetail(int personID)
        {
            return Json(new PersonViewModel()
            {
                FirstName = "FirstName " + personID.ToString(),
                LastName = "LastName " + personID.ToString(),
                Sex = "Sex " + personID.ToString(),
                Age = personID,
                Address = "Address " + personID.ToString()
            });
        }
Here we are just building an in memory detail. And we can call the controller method like-
    self.getDetail = function(item) { 
        $.ajax({
            url:  '@Url.Action("GetDetail","Person")',
            data: { personID: item.PersonID },
            type: "POST",
            success: function (response) {
                self.selectedItem(response); 
            },
            error:function(x,y,z){debugger;}
        });
    }
Inside the success method we are getting the result of the ajax call and assigning the result to the selectedItem(self.selectedItem(response);). As it’s an observable, knockout will automatically update the corresponding HTML for detail. That’s all. You can download the source code from this link.

Tuesday, July 10, 2012

Restrict datepicker date using database driven dates

In this post we will be discussing restricting dates in jQuery UI datepicker dates using database driven dates.

We can restrict date using beforeShowDay event of the datepicker. Inside this function we can return [true] if we want the date to be enabled and return [false] if we want to disable date.

Let’s first get the date from server. For simplicity we will simply return an in memory date array like below-
    [WebMethod]
    public static List<string> GetDates()
    { 
        List<string> arr= new List<string>();
        arr.Add("2012-07-12");
        arr.Add("2012-07-25");
        arr.Add("2012-07-28");
        arr.Add("2012-07-13");
        arr.Add("2012-07-20");
        return arr;
    }
We can call this method from jQuery ajax like below-
<html xmlns="http://www.w3.org/1999/xhtml">
<head id="Head1" runat="server">
    <script src="http://ajax.aspnetcdn.com/ajax/jQuery/jquery-1.7.js" type="text/javascript"></script>
    <script src="http://ajax.aspnetcdn.com/ajax/jquery.ui/1.8.9/jquery-ui.js" type="text/javascript"></script>
    <link href="http://ajax.aspnetcdn.com/ajax/jquery.ui/1.8.9/themes/redmond/jquery-ui.css"
        rel="stylesheet" type="text/css" />
    <script type="text/javascript">
        $(function () {
            $.ajax({
                type: "POST",
                contentType: "application/json",
                data: "{}",
                url: "jquery datepicker fill with sql database dates.aspx/GetDates",
                dataType: "json",
                success: function (data) {
                    //enable date picker 
                },
                error: function (XMLHttpRequest, textStatus, errorThrown) {
                    debugger;
                }
            });
        });
    </script>
</head>
<body>
    <form id="form1" runat="server">
    <div>
        <asp:TextBox ID="TextBox1" runat="server"></asp:TextBox>
    </div>
    </form>
</body>
</html>
In the success method we can enable the datepicker and restrict the date by using the date from server (data.d). The code goes here-
$('#TextBox1').datepicker({
        minDate: new Date(2012, 6, 10),
        maxDate: new Date(2012, 8, 28),
        beforeShowDay: function (date) {
            function addZero(no) {
                if (no < 10) {
                    return "0" + no;
                } else {
                    return no;
                }
            }

        var date_str = [
        addZero(date.getFullYear()),
        addZero(date.getMonth() + 1),
        addZero(date.getDate())
        ].join('-');

        if ($.inArray(date_str, data.d) != -1) {
            return [true];
        } else {
            return [false];
        }
    }
});
What we are doing inside beforeShowDay is preparing the date string(date_str) in the format yyyy-mm-dd and then checking whether this date exists in the array data.d. If exists return [true] else return [false].

Wednesday, June 27, 2012

Copy a network (shared folder) file using c#

Recently I came across a requirement to copy a network file (shared folder file) in regular time interval. I tried many options. Finally following approach worked properly.

We can do following-
  1. Login to a user account using c#.
  2. Impersonate as the logged in user.
  3. Copy the file using System.IO.File.Copy.

For step 1 we can login to a user account using LogonUser of advapi32.dll. To consume this method we need to do dll import as follows. We can add the following method in the current class-
[System.Runtime.InteropServices.DllImport("advapi32.dll", SetLastError = true, CharSet = System.Runtime.InteropServices.CharSet.Unicode)]
public static extern bool LogonUser(String lpszUsername, String lpszDomain, String lpszPassword, int dwLogonType, int dwLogonProvider, ref IntPtr phToken);
We can see the detail of the method here-

http://msdn.microsoft.com/en-us/library/windows/desktop/aa378184%28v=vs.85%29.aspx

Next we can call the method like below-
IntPtr tokenHandle = new IntPtr(0);
bool returnValue = LogonUser("usermane", "domain", "password", 2, 0, ref tokenHandle);
if (!returnValue)
throw new Exception("Logon failed.");
For step 2 we can impersonate the logon user by the Impersonate method of WindowsIdentity class as follows-
System.Security.Principal.WindowsImpersonationContext impersonatedUser = null;
System.Security.Principal.WindowsIdentity wid = new System.Security.Principal.WindowsIdentity(tokenHandle);
impersonatedUser = wid.Impersonate();
And finally for step 3 we can copy the file as-
System.IO.File.Copy("SourceFile", "DestinationFile", true);
For source and the destination file either a network file or a local file. We also need to take care of proper access right of the shared folder.

Wednesday, June 13, 2012

Passing extra parameters with dataTable.net plugin while server paging is enabled in asp.net MVC 3 and Web form

Recently I have added two posts to implement dataTable.net jQuery plugin with server side paging with MVC3 and asp.net web form. First one is in MVC 3 and second one is in web form. We can find these two posts here-

http://growingtech.blogspot.in/2012/06/ajax-data-paging-with-datatablesnet.html
http://growingtech.blogspot.in/2012/06/ajax-data-paging-with-datatablesnet_06.html

I will request to study these two posts in sequentially to understand this one.

In this post we will be discussing how to pass additional parameters when page index changes happen in dataTable.net. To pass additional parameters in ajax paging we can use fnServerParams function of dataTable. In the MVC post we have discussed how dataTable plugin adds request parameters as querystring. And this function (fnServerParams) provides an input parameter which is nothing but an array of the query string parameters. We can do modification to the array in the function to accomodiate our need of extra parameters. Each array element in the input array is an object of the following form-
{ "name": "name of parameter/querystring", "value": "value of parameter/querystring " }
So, we can add our additional parameter accordingly. Suppose we have following input data as additional parameter-
First Criteria: <input id="txtParameter1" /><br />
Second Criteria : <input id="txtParameter2" />
We can add the these extra parameter like below-
<script type="text/javascript" charset="utf-8">
    $(document).ready(function () {
        $('#example').dataTable({
            "bServerSide": true,
            "bProcessing": true,
            "sPaginationType": "full_numbers",
            "sAjaxSource": 'Datatable Plugin Pagination Issue AjaxPath.aspx',
            "fnServerParams": function (aoData) {
                aoData.push(
                    { "name": "firstcriteria", "value": $("#txtParameter1").val() },
                    { "name": "secondcriteria", "value": $("#txtParameter2").val() }
                );
            }
        });
    });
</script>
In web form:

In web form we can access these parameters like below and use for database operations –
var firstCriteria = Request.QueryString["firstcriteria"];
var secondCriteria = Request.QueryString["secondcriteria"];
In MVC 3-

To use in MVC 3 we can modify data model like below to accommodate our new parameters-
    public class TableParameter
    {
        public string sEcho { get; set; }
        public int iDisplayStart { get; set; }
        public int iDisplayLength { get; set; }
        public string firstcriteria { get; set; }
        public string secondcriteria { get; set; }
    }
Input data will be available in the controller method to use.

Replace smiley code with images in a chat application in JavaScript

Many application supports adding smiley. In the text area, used for typing, we enter some text code like :) and on enter we can we can see in the history of chat this gets converted to smiley image. We can implement this by-
<script type="text/javascript">
    var replacement = { ":)": "<img src='smiley1.png' />", ":(": "<img src='smiley2.png' />", ":-)": "<img src='smiley3.png' />" };
    var string = ":) is a smily where :( another. :-) is one more";
    string = escape(string);
    for (var val in replacement)
        string = string.replace(new RegExp(escape(val), "g"), replacement[val]);
    string = unescape(string);
</script>
Special characters are not properly recognized in this case. That why escape and unescape is used.

Tuesday, June 12, 2012

Its time for free data storage - SkyDrive

Looking for a free space in the sky(http://www). It time to celebrate. Microsoft is providing up to 7 GB free space in https://skydrive.live.com/. You can use this for free data storage.

You can install the sky tool in your system and event configure a folder with the tool. The tool will take care of sinking your folder data in in the sky.

Its great. For detail check this-

http://windows.microsoft.com/en-in/skydrive/home

Getting started with amazon simple storage service (S3) with dot net

Recently I was getting hard time to work with amazon S3 with C#. I am sharing my experience here. To start with we can create an account in http://aws.amazon.com/. It’s free to create an account here. But we have to pay for the services we want to use. There are many services available. We can choose what we need.

I had a requirement to save a file in the cloud, a json file. And periodically update the file. It’s just a storage need. So we have chosen the S3.

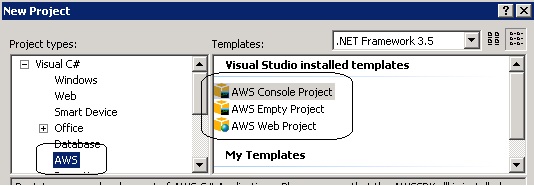
Now before going forward as we are supposed to do the uploading with C#, let’s first download the dot net SDK from http://aws.amazon.com/sdkfornet/ and install the SDK. This installation will give new project templates for working with cloud. After installation there will be following project templates available for development.


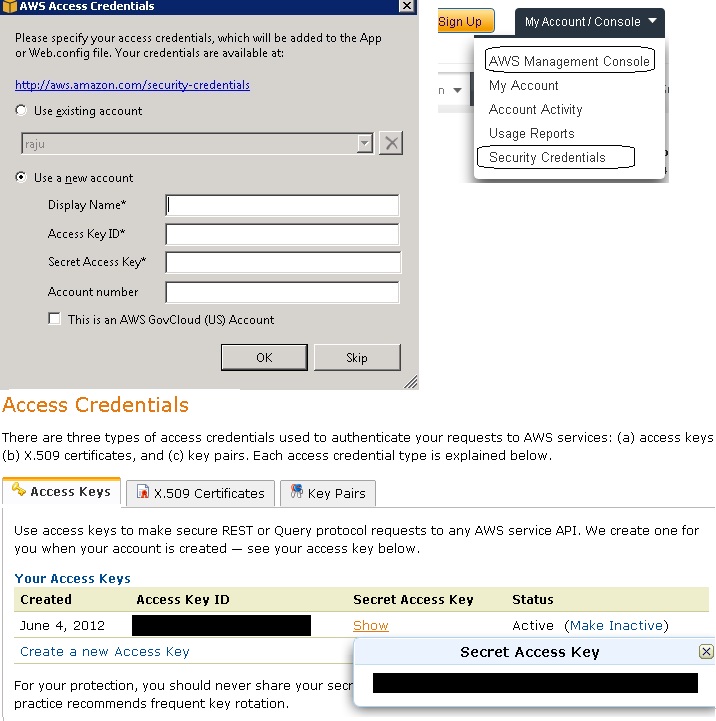
If we choose any of the three project types and create a project we will get a popup asking Display name, Access Key Id, Secret Access Key. To get the keys we can go to own account (click on My Account/Console Link on the top) then go to Security Credentials. If we are able to visit page we will get Access Credentials like in the image below. Here I have blacked out my credentials. We can now fill the credentials and click ok. For the name we can choose any name. VS will save this name for shortcut of the given credentials. If we visit the web config or appconfig we can see the following app keys-
 <appSettings>
  <add key="AWSAccessKey" value="********************"/>
  <add key="AWSSecretKey" value="****************************************"/>
</appSettings>
Also the template will add a dll named AWSSDK.dll to the solution which contains the API library needed to communicate with S3 cloud.

If not able to visit credential page, no need to worry we will get there soon.


Now we can go to the management console. In the above image we can click AWS Management Console. We will go the console page. From the page we can choose S3. We can find it in two place- top tab and under Amazon Web Services. Both are marked in the image below. If we have created a normal account, we will not be able to do anything. We will get the message in the yellow background as in the image.


To consume this we have to signup (purchase) S3 here. As discussed earlier if we are not able to find the credentials, we will be able to find after purchase.

After we have signed up we can go to the console. And we can see two sections. Left is bucket and right is files and folders. To add any file we need to have a bucket. We can consider a bucket is nothing but a grouping of files and folders. We can group file in different folder hierarchy in the right side. To create a bucket we can chose create bucket button in the left side. We can give a name and select a region. We can create and delete a bucket from C# like this-

Create a bucket:
Amazon.S3.AmazonS3 s3Client = Amazon.AWSClientFactory.CreateAmazonS3Client();
Amazon.S3.Model.PutBucketRequest bucket = new Amazon.S3.Model.PutBucketRequest();
bucket.BucketName = "ag_testbucket";
bucket.BucketRegion = Amazon.S3.Model.S3Region.US;
s3Client.PutBucket(bucket);
What we are doing here is creating an amazon S3 object. And then creating a PutBucketRequest object and using the S3 object we are creating the bucket. Similarly we can delete a bucket using DeleteBucketRequest object like below-

Delete a bucket:
Amazon.S3.AmazonS3 s3Client = Amazon.AWSClientFactory.CreateAmazonS3Client();
Amazon.S3.Model.DeleteBucketRequest bucketDelete=new Amazon.S3.Model.DeleteBucketRequest();
bucketDelete.BucketName = "ag_testbucket";
s3Client.DeleteBucket(bucketDelete);
Create and update a file in cloud:
Amazon.S3.AmazonS3 s3Client = Amazon.AWSClientFactory.CreateAmazonS3Client();
try
{
    string strBucketName="your_bucket_name";
    Amazon.S3.Model.ListBucketsResponse response = s3Client.ListBuckets();
    if (response.Buckets != null && response.Buckets.Where(b=>b.BucketName==strBucketName).Count()>0)
    {
        String strFileName = "test.txt";
        PutObjectRequest request = new PutObjectRequest();
        request.WithBucketName(strBucketName);
        request.WithKey(strFileName);

        //create data and add with the following line

        request.WithContentBody("sone dummy text");

        PutObjectResponse objResponse = s3Client.PutObject(request);
    }
}
catch (AmazonS3Exception ex)
{
}
To create and upload a text file using S3, we need to create an S3 client and then we have to use a bucket to upload the file. By if statement we are checking whether the bucket being used is available or not. And then we are uploading the file in the bucket.

Wednesday, June 6, 2012

jqPlot bar graph with asp.net MVC 3

In this post we will be exploring using jqPlot bar graph with asp.net MVC 3. We can download the plugin for the below location-

http://www.jqplot.com/

To start with let’s see how bar graph works. Following is code for a bar graph with HTML and JavaScript bar data object-
<link class="include" rel="stylesheet" type="text/css" href="@Url.Content("~/scripts/jqplot/css/jquery.jqplot.min.css")" />
<!--[if lt IE 9]><script language="javascript" type="text/javascript" src="@Url.Content("~/scripts/jqplot/excanvas.min.js")"></script><![endif]-->
<script type="text/javascript" src="@Url.Content("~/scripts/jqPlot/jquery.jqplot.min.js")"></script>
@*<script type="text/javascript" src="@Url.Content("~/scripts/jqplot/jqplot.canvasTextRenderer.min.js")"></script>
<script type="text/javascript" src="@Url.Content("~/scripts/jqplot/jqplot.canvasAxisTickRenderer.min.js")"></script>*@
<script type="text/javascript" src="@Url.Content("~/scripts/jqplot/jqplot.categoryAxisRenderer.min.js")"></script>
<script type="text/javascript" src="@Url.Content("~/scripts/jqPlot/jqplot.barRenderer.min.js")"></script>

<div class="example-content">
    <!-- Example scripts go here -->
    <style type="text/css">
        .jqplot-target
        {
            margin: 30px;
        }
        .tooltipCss
        {
            position: absolute;
            background-color: #b2b1ac;
            color: White;
            z-index: 200;
            padding: 5px;
            border-radius: 5px;
            display: none;
        }
    </style>
    <div id="chart2" class="plot" style="width: 760px; height: 360px;">
    </div>
</div>
<script language="javascript" type="text/javascript">
    $(document).ready(function () {
        pop1980 = [4, 5, 3, 6, 5, 4, 2, 5];
        pop1990 = [3, 5, 6, 2, 4, 3, 4, 6];
        pop2000 = [2, 5, 6, 3, 4, 5, 2, 4];
        pop2008 = [5, 3, 4, 2, 6, 5, 2, 4];

        ticks = [5, 6, 7, 8, 9, 10, 11, 12];

        series = [
                  { label: 'r. DMR Published - Singapore' },
                  { label: 's. DMR Published - London' },
                  { label: 't. DMR Published - Houston' },
                  { label: 'u. DMR Published - Global' }
               ];

        plot2 = $.jqplot('chart2', [pop1980, pop1990, pop2000, pop2008], {
            legend: {
                show: true,
                placement: 'outsideGrid'
            },
            seriesDefaults: {
                renderer: $.jqplot.BarRenderer,
                rendererOptions: {
                    barPadding: 5
                }
            },
            series: series,
            axes: {
                xaxis: {
                    renderer: $.jqplot.CategoryAxisRenderer,
                    ticks: ticks
//                    ,
//                    tickRenderer: $.jqplot.CanvasAxisTickRenderer,
//                    tickOptions: {
//                        angle: -15
//                    }
                }
            }
        });
        $('#chart2').bind('jqplotDataMouseOver',
            function (ev, seriesIndex, pointIndex, data) {
                $('#info2').html('series "' + series[seriesIndex].label + '" point "' + (pointIndex + 5) + '"<br /> value "' + data[1] + '"');
                $('#info2').css({ "left": ev.pageX + 3, "top": ev.pageY })
                $('#info2').show();
            }
        );
        $('#chart2').bind('jqplotDataUnhighlight',
            function (ev) {
                $('#info2').hide();
            }
        );
    });
</script>
<div id="info2" class="tooltipCss">
</div>
If you check the file references, you can check a file named excanvas.min.js. This is the file for internet explorer less than 9. As the bar is rendered in canvas, a HTML 5 feature, which is not supported in lower versions of IE. All other files are required for bar graph. If you notice, you can see there are two files that are commented out (jqplot.canvasTextRenderer.min.js and jqplot.canvasAxisTickRenderer.min.js ). These two files are needed if you want to rotate the tick texts in both the axis. In the bar initialization you can find the corresponding tickRenderer code is commented out for x-axis. Div with id chart2 is used to hold the bar graph. And div with id info2 is used to hold tooltip content. Input to the graph is array of arrays where each inner array represents data for each bar.

Number of items in each inner array is same. Other than this array there are two more arrays used. One is ticks, this is used to represent the data interval in x- axis. And another is series, this array is used to represent the name of each bar. The order of the series item should be same as the order of the data input arrays.

There are many options used in the plugin. Detail of various options can be found here-

http://www.jqplot.com/docs/files/jqPlotOptions-txt.html
http://www.jqplot.com/docs/files/optionsTutorial-txt.html

We can use as many options required in this case.

Other than these we are using two more events in the plugin named 'jqplotDataMouseOver' and 'jqplotDataUnhighlight'. We are using these events to track tooltips in each bar. We can add debugger and check what is happening.

Model driven Bar Graph:

To make the graph model driven we can have the following model-
namespace Bar.Models
{
    public class BarViewModel
    {
        public int Id { get; set; }
        public string BarName { get; set; }
        public int[] Values { get; set; }
    }
    public class BarDataViewModel
    {
        public int[] TickValues { get; set; }
        public List<BarViewModel> Data { get; set; }
    }
}
And in the controller action we are creating the data in memory as –
        public ActionResult ModelDrivenBar()
        {
            BarDataViewModel data = new BarDataViewModel();
            data.Data = new List<BarViewModel>();
            BarViewModel bar;
            Random r=new Random();
            for (int i = 0; i < 4; i++)
            {
                bar = new BarViewModel();
                bar.Id = i;
                bar.BarName = "Bar Name " + i.ToString();
                bar.Values = new int[10];
                for (int j = 0; j < 10; j++)
                    bar.Values[j] = r.Next(2, 6);
                data.Data.Add(bar);
            }
            data.TickValues = new int[10];
            for (int i = 5; i < 15; i++)
                data.TickValues[i - 5] = i;
            return View(data);
        }
We need to do two changes in the view to accommodate the changes. First add the following line at the starting of the view-
@model Bar.Models.BarDataViewModel
And secondly generate the three arrays, as we have discussed earlier, like below-
        var data = new Array();
        var ticks = new Array();
        var series = new Array();
        @foreach (var d in Model.TickValues)
        {
            <text>ticks.push(</text>@d<text>);</text>
        }
        @foreach (var d in Model.Data)
        {
            <text>var bar</text>@d.Id<text>= new Array();</text>
            <text>series.push({label : "</text>@d.BarName<text>"});</text>
            foreach (var darray in d.Values)
            { 
                <text>bar</text>@d.Id<text>.push(</text>@darray<text>);</text>
            }
            <text>data.push(bar</text>@d.Id<text>);</text>
        }
        plot2 = $.jqplot('chart2', data, {
Instead of explaining the code above, we can check the output of the code below-
        var data = new Array();
        var ticks = new Array();
        var series = new Array();
            ticks.push(5);
            ticks.push(6);
            ticks.push(7);
            ticks.push(8);
            ticks.push(9);
            ticks.push(10);
            ticks.push(11);
            ticks.push(12);
            ticks.push(13);
            ticks.push(14);
            var bar0= new Array();
            series.push({label : "Bar Name 0"});
                bar0.push(2);
                bar0.push(4);
                bar0.push(5);
                bar0.push(5);
                bar0.push(4);
                bar0.push(3);
                bar0.push(2);
                bar0.push(2);
                bar0.push(3);
                bar0.push(5);
            data.push(bar0);
            var bar1= new Array();
            series.push({label : "Bar Name 1"});
                bar1.push(4);
                bar1.push(2);
                bar1.push(2);
                bar1.push(5);
                bar1.push(2);
                bar1.push(3);
                bar1.push(4);
                bar1.push(5);
                bar1.push(5);
                bar1.push(2);
            data.push(bar1);
            var bar2= new Array();
            series.push({label : "Bar Name 2"});
                bar2.push(4);
                bar2.push(3);
                bar2.push(3);
                bar2.push(4);
                bar2.push(2);
                bar2.push(2);
                bar2.push(2);
                bar2.push(3);
                bar2.push(4);
                bar2.push(5);
            data.push(bar2);
            var bar3= new Array();
            series.push({label : "Bar Name 3"});
                bar3.push(5);
                bar3.push(4);
                bar3.push(5);
                bar3.push(2);
                bar3.push(4);
                bar3.push(3);
                bar3.push(5);
                bar3.push(4);
                bar3.push(3);
                bar3.push(5);
            data.push(bar3);
        plot2 = $.jqplot('chart2', data, {
What we are doing here is just creating the bar data dynamically by looping the model data.

Ajax Bar Graph:

To make it ajax driven we can simply change the controller return type like below-
        public JsonResult AjaxBarData()
        {
            //same code like earlier
            return Json(data,JsonRequestBehavior.AllowGet);
        }
And we can do an ajax call to the controller and in the success of the ajax call we can initialize the graph-
<script type="text/javascript">
    $(document).ready(function () {
        $.ajax({
            type: "get",
            timeout: 30000,
            url: '@Url.Action("AjaxBarData")',
            dataType: "json",
            contentType: "application/json; charset=utf-8",
            success: function (result) {
                var data = new Array();
                var ticks = new Array();
                var series = new Array();
                $(result.TickValues).each(function (i, itm) {
                    ticks.push(itm);
                });
                $(result.Data).each(function (i, itm) {
                    series.push({ label: itm.BarName });
                    data[i] = new Array();
                    $(itm.Values).each(function (j, item) {
                        data[i].push(item);
                    });
                });
  //initialize the bar graph here
                plot2 = $.jqplot('chart2', data, {
            },
            error: function (req, status, error) {
                debugger;
            }
        });
    });
</script>
That’s all. You can download the bar code here.

Ajax data paging with dataTables.net jQuery plugin in asp.net web form

I have recently added a post on calling ajax data to dataTables.net jQuery plugin with asp.net MVC 3. You can refer the following post-

http://growingtech.blogspot.in/2012/06/ajax-data-paging-with-datatablesnet.html

I will suggest to study the above post before proceeding this post. But the approach does not work with web form. So, how to do it with web form. As per my knowledge ajax paging with dataTable.net does not work properly with pagemethod or web service. We can solve this with an aspx page directly. But please take care of the security constraints as per your requirement.

First add a aspx page separate from your previous page. And change the sAjaxSource of the dataTable plugin like-
"sAjaxSource": 'Datatable Plugin Pagination Issue AjaxPath.aspx'
And in page load of the page use the following code-
public partial class Datatable_Plugin_Pagination_Issue_AjaxPath : System.Web.UI.Page
{
    protected void Page_Load(object sender, EventArgs e)
    {
        var data = new[]{   
                new []{"Trident test","Internet Explorer 4.0","Win 95+","4","X"},
                new []{"Trident","Internet Explorer 5.0","Win 95+","5","C"},
                new []{"Trident","Internet Explorer 5.5","Win 95+","5.5","A"},
                new []{"Trident","Internet Explorer 6","Win 98+","6","A"},
                new []{"Trident","Internet Explorer 7","Win XP SP2+","7","A"},
                new []{"Trident","AOL browser (AOL desktop)","Win XP","6","A"},
                new []{"Gecko","Firefox 1.0","Win 98+ / OSX.2+","1.7","A"},
                .
                .
                .
                .
                new []{"Other browsers","All others","-","-","U"}
            };
        var pagedData = data.Skip(int.Parse(Request.QueryString["iDisplayStart"])).Take(int.Parse(Request.QueryString["iDisplayLength"]));
        System.Web.Script.Serialization.JavaScriptSerializer toJSON = new System.Web.Script.Serialization.JavaScriptSerializer();
        Response.Clear();
        string dataString = toJSON.Serialize(new
        {
            sEcho = Request.QueryString["sEcho"],
            iTotalRecords = data.Count(),
            iTotalDisplayRecords = data.Count(),
            aaData = pagedData
        });
        Response.Write(dataString);
        Response.End();
    }
}
That's all. Problem solved.

Tuesday, June 5, 2012

jqPlot Line with asp.net MVC 3

In this post we will be exploring using jqPlot line graph with asp.net MVC 3. Before starting with MVC, let’s see how line graph works. Let’s first download the plugin from-

http://www.jqplot.com/

To start with let’s see how line graph works. First let’s include the following file references-
<link class="include" rel="stylesheet" type="text/css" href="@Url.Content("~/scripts/jqplot/css/jquery.jqplot.min.css")" />
<!--[if lt IE 9]><script language="javascript" type="text/javascript" src="@Url.Content("~/scripts/jqplot/excanvas.min.js")"></script><![endif]-->
<script type="text/javascript" src="@Url.Content("~/scripts/jqPlot/jquery.jqplot.min.js")"></script>
<script type="text/javascript" src="@Url.Content("~/scripts/jqplot/jqplot.canvasTextRenderer.min.js")"></script>
<script type="text/javascript" src="@Url.Content("~/scripts/jqplot/jqplot.canvasAxisTickRenderer.min.js")"></script>
<script type="text/javascript" src="@Url.Content("~/scripts/jqplot/jqplot.dateAxisRenderer.min.js")"></script>
@*<script type="text/javascript" src="@Url.Content("~/scripts/jqplot/jqplot.highlighter.min.js")"></script>*@
For this demo we are going to use the following CSS-
<style type="text/css">
    .jqplot-point-label
    {
        white-space: nowrap;
    }
    div.jqplot-target
    {
        height: 400px;
        width: 750px;
        margin: 70px;
    }
    .tooltipCss
    {
        position: absolute;
        background-color: #b2b1ac;
        color: White;
        z-index: 200;
        padding: 5px;
        border-radius: 5px;
        display: none;
    }
</style>
Following is the code used to activate the line plugin-
<script type="text/javascript">
    $(document).ready(function () {
        var line1 = [['2/2/2008', 10], ['2/5/2008', 56], ['2/7/2008', 39], ['2/10/2008', 81], ['2/15/2008', 10], ['2/18/2008', 56], ['2/22/2008', 39], ['2/30/2008', 81]];
        var line2 = [['2/16/2008', 43], ['2/18/2008', 45], ['2/17/2008', 50], ['2/12/2008', 40], ['2/1/2008', 10], ['2/14/2008', 56], ['2/7/2008', 39], ['2/22/2008', 81], ['2/29/2008', 81]];
        var labels = [
                   { label: 'serie name 1', lineWidth: 1 },
                   { label: 'serie name 2', lineWidth: 1 }
                ];

        var plot2 = $.jqplot('chart1', [line1, line2], {
            series: labels,
            legend: {
                show: true,
                placement: 'outsideGrid'
            },
            //                highlighter: {
            //                    show: true,
            //                    showTooltip: true,
            //                    yvalues: 2,
            //                    formatString: '<table class="jqplot-highlighter"><tr><td>Point </td><td>"%s"</td></tr><tr><td>value </td><td>"%s"</td></tr><tr><td>Series </td><td>"%s"</td></tr></table>'
            //                },
            cursor: {
                show: true,
                tooltipLocation: 'sw'
            },
            axes: {
                xaxis: {
                    tickRenderer: $.jqplot.CanvasAxisTickRenderer,
                    renderer: $.jqplot.DateAxisRenderer,
                    label: 'Date',
                    tickOptions: {
                        angle: -15,
                        formatString: '%m/%d/%y'
                    }
                },
                yaxis: {
                    label: 'Value',
                    labelRenderer: $.jqplot.CanvasAxisLabelRenderer
                }
            }
        });

        $('#chart1').bind('jqplotDataMouseOver',
                    function (ev, seriesIndex, pointIndex, data) {
                        date = new Date(data[0]);
                        $('#info2').html('series "' + labels[seriesIndex].label + '" point "' + (date.getMonth() + 1) + "/" + (date.getDate() < 10 ? "0" + date.getDate() : date.getDate()) + "/" + date.getFullYear() + '"<br /> value "' + data[1] + '"');
                        $('#info2').css({ "left": ev.pageX + 3, "top": ev.pageY })
                        $('#info2').show();
                    }
                );
        $('#chart1').bind('jqplotDataUnhighlight',
                    function (ev) {
                        $('#info2').hide();
                    }
            );
    });
</script>
<div class="example-content">
    <div class="example-plot" id="chart1">
    </div>
</div>
<div id="info2" class="tooltipCss">
</div>
Here I am not going to explain the detail of the plugin. There are many options used in the plugin. Detail of various options can be found here-

http://www.jqplot.com/docs/files/jqPlotOptions-txt.html
http://www.jqplot.com/docs/files/optionsTutorial-txt.html

And we can use the options whatever serves our purpose. You can see some commented code in the plugin that is highlighter. There are many options available in the highlighter, but managing the tooltip HTML is not that great. So, I wish to use separate highlighter.

I have used the div with id info2 to hold the tooltip content. As you can, two events are attached to the plugin 'jqplotDataMouseOver' and 'jqplotDataUnhighlight' to deal with tooltip on the points on the line graph. First one is used for mouse over and the second one is used for mouse out.

If we check the input data to the plugin is nothing but an array of lines where each line is in turn array of points. Each point is intern is an array of two elements. First one is date and second is the value for that date.

So, if we want to implement using MVC is nothing but returning this data array. Also as you can see that we have used a separate array named labels to hold the names of the lines.

Model driven Line:

Let’s implement it with MVC 3. To start with let’s have the following model-
namespace Line.Models
{
    public class LineViewModel
    {
        public int id { get; set; }
        public string LineName { get; set; }
        public List<LineDataViewModel> data { get; set; } 
    }
    public class LineDataViewModel
    {
        public DateTime Date { get; set; }
        public double Value { get; set; }
    }
}
Everything is same as previous implementation except the data creation. Let’s first replace the first line of the plugin initialization by the following line-
var plot2 = $.jqplot('chart1', line, {
And also the view should accept the following model-
@model  List
Let’s now build the data array "line" and series "labels". Now gets generate some random data in action method and pass to the view like below-
        public ActionResult ModelDrivenLine()
        {
            Random r = new Random();
            List<LineViewModel> data = new List<LineViewModel>();
            
            LineViewModel l1 = new LineViewModel();
            l1.LineName = "First line";
            l1.id = 1;
            l1.data = new List<LineDataViewModel>();
            for (int i = 0; i < 10; i++)
                l1.data.Add(new LineDataViewModel() { Date = DateTime.Now.AddDays(r.Next(1, 25)), Value = r.Next(1, 10) });
            data.Add(l1);

            LineViewModel l2 = new LineViewModel();
            l2.LineName = "Second line";
            l2.id = 2;
            l2.data = new List<LineDataViewModel>();
            for (int i = 0; i < 10; i++)
                l2.data.Add(new LineDataViewModel() { Date = DateTime.Now.AddDays(r.Next(1, 25)), Value = r.Next(1, 10) });
            data.Add(l2);

            return View(data);
        }
Now we can generate the data by the following code-
        var line = new Array();
        var labels = new Array();
        @foreach (var m in Model)
        {
            <text>labels.push({label: "</text>@m.LineName<text>"}); 
            var line</text>@m.id<text> =new Array();</text>
            foreach (var l in m.data)
            {
                <text> line</text>@m.id<text>.push(["@l.Date.ToString("M/dd/yyyy")", @l.Value]);</text>
            }
            <text>line.push(line</text>@m.id<text>);</text>
        }
What we are doing is looping the model data and creating two required array. Here <text></text> is used to direct the razor engine to render the data as text. Line <text>labels.push({label: "</text>@m.LineName<text>"}); is used to create series name (the array for name of the lines(labels)). If you see the model there is a separate property as Id. This is used to uniquely identify each line. And you can see in line var line</text>@m.id<text> =new Array();</text> we are creating array for each line, so if id is one, the result of the line will be var line1 =new Array();. And with the next for loop we are pushing the line values to the corresponding array. And the next line we are adding the array to the final data array. That's all.

The result of the above code will look like-
        var line = new Array();
        var labels = new Array();
            labels.push({label: "First line"}); 
            var line1 =new Array();
                 line1.push(["6/21/2012", 2]);
                 line1.push(["6/15/2012", 8]);
                 line1.push(["6/06/2012", 9]);
                 line1.push(["6/13/2012", 2]);
                 line1.push(["6/09/2012", 2]);
                 line1.push(["6/15/2012", 8]);
                 line1.push(["6/09/2012", 5]);
                 line1.push(["6/13/2012", 8]);
                 line1.push(["6/23/2012", 5]);
                 line1.push(["6/12/2012", 1]);
            line.push(line1);
            labels.push({label: "Second line"}); 
            var line2 =new Array();
                 line2.push(["6/11/2012", 9]);
                 line2.push(["6/27/2012", 2]);
                 line2.push(["6/27/2012", 6]);
                 line2.push(["6/21/2012", 5]);
                 line2.push(["6/13/2012", 6]);
                 line2.push(["6/08/2012", 5]);
                 line2.push(["6/07/2012", 7]);
                 line2.push(["6/18/2012", 8]);
                 line2.push(["6/19/2012", 7]);
                 line2.push(["6/15/2012", 6]);
            line.push(line2);
        var plot2 = $.jqplot('chart1', line, {
Now if we want to use jQuery ajax to get data from the controller action and use it to the line graph. We can do it simply. We can have a view from the view we can do an ajax call to controller action. And the action method goes like below-
        public JsonResult AjaxLineJSON()
        {
            //This part is just like the previous action method
            return Json((from d in data
                select new {d.LineName,data= (from tl in d.data
                                         select new { Date= tl.Date.ToString("M/dd/yyyy"), Value=tl.Value}).ToList()}), JsonRequestBehavior.AllowGet);
        }
And the ajax call looks like-
<script type="text/javascript">
    $(document).ready(function () {
        $.ajax({
            type: "get",
            timeout: 30000,
            url: '@Url.Action("AjaxLineJSON")',
            dataType: "json",
            contentType: "application/json; charset=utf-8",
            success: function (result) {
                var line = new Array();
                var series = new Array();
                $(result).each(function (i, itm) {
                    series.push(itm.LineName);
                    line[i] = new Array();
                    $(itm.data).each(function (j, item) {
                        line[i].push([item.Date, item.Value])
                    });
                });
                //initialize the graph here.
        });
    });
</script>
That is all for now. You can download the code from here.
Sunday, June 3, 2012

Ajax data paging with dataTables.net jQuery plugin in asp.net MVC 3

In this post we will be discussing how to do ajax based server side data paging with dataTables.net jQuery plugin in asp.net MVC 3. To continue this lets check following post –

http://datatables.net/examples/data_sources/ajax.html

This is a basic way to access ajax data paging. In this sample all the data needed is retrieved and paging is done in browser memory. But we need more sophisticated approach. That is separate ajax call for each page index change. We can follow the following post for this-

http://datatables.net/examples/data_sources/server_side.html

This is a PHP based code. Let’s do in MVC. Before starting, let’s do some background study on the same.

First case: Let’s see the request on the IE developer tool network tab. If we visit request header and request value we can get data like below-

/examples/examples_support/server_processing.php?sEcho=1&iColumns=5&sColumns=&iDisplayStart=0&iDisplayLength=10&mDataProp_0=0&mDataProp_1=1&mDataProp_2=2&…………….. The bolded text query strings are the required ones. The additional query string can be used are we need but these are out of scope for the current sample.

Second case: Now let’s go to the Response Body. We can get the result like below-

{"sEcho": 1, "iTotalRecords": 57, "iTotalDisplayRecords": 57, "aaData": [ ["Gecko","Firefox 1.0","Win 98+ / OSX.2+","1.7","A"],["Gecko","Firefox 1.5","Win 98+ / OSX.2+","1.8","A"],["Gecko","Firefox 2.0","Win 98+ / OSX.2+","1.8","A"],["Gecko","Firefox 3.0","Win 2k+ / OSX.3+","1.9","A"],["Gecko","Camino 1.0","OSX.2+","1.8","A"],["Gecko","Camino 1.5","OSX.3+","1.8","A"],["Gecko","Netscape 7.2","Win 95+ / Mac OS 8.6-9.2","1.7","A"],["Gecko","Netscape Browser 8","Win 98SE+","1.7","A"],["Gecko","Netscape Navigator 9","Win 98+ / OSX.2+","1.8","A"],["Gecko","Mozilla 1.0","Win 95+ / OSX.1+","1","A"]] }

Here we can see that it returning the sEcho, iTotalRecords, iTotalDisplayRecords, aaData where first three values are integer type and last one is the array of data rows. We can visualize this in the image below-


Now if we think this in terms of MVC model binding things will get clear. We can use a model data class that except the required input parameters and return a JSON result of the desired format. Lets start with the source code-

ViewModel-
    public class TableParameter
    {
        public string sEcho { get; set; }
        public int iDisplayStart { get; set; }
        public int iDisplayLength { get; set; }
    }
In case of the parameter we are using only three here as explained in the first case. We can use other parameters as per our need.

View-
@{
    ViewBag.Title = "Pagination_With_Data_Table_issue";
    Layout = "~/Views/Shared/_Layout.cshtml";
}
<h2>
    Pagination_With_Data_Table_issue</h2>
    
<style type="text/css" title="currentStyle">
   @@import "http://datatables.net/release-datatables/media/css/demo_page.css";
   @@import "http://datatables.net/release-datatables/media/css/demo_table.css";
  </style>
<script type="text/javascript" language="javascript" src="http://datatables.net/release-datatables/media/js/jquery.js"></script>
<script type="text/javascript" language="javascript" src="http://datatables.net/release-datatables/media/js/jquery.dataTables.js"></script>
<script type="text/javascript" charset="utf-8">
    $(document).ready(function () {
        $('#example').dataTable({
            "bServerSide": true,
            "bProcessing": true,
            "sPaginationType": "full_numbers",
            "sAjaxSource": '@Url.Action("Pagination_With_Data_Table_issue_getData")'
        });
    });
</script>
<div id="dynamic">
<table cellpadding="0" cellspacing="0" border="0" class="display" id="example">
 <thead>
  <tr>
   <th width="20%">Rendering engine</th>
   <th width="25%">Browser</th>
   <th width="25%">Platform(s)</th>
   <th width="15%">Engine version</th>
   <th width="15%">CSS grade</th>
  </tr>
 </thead>
 <tbody>
 </tbody>
 <tfoot>
  <tr>
   <th>Rendering engine</th>
   <th>Browser</th>
   <th>Platform(s)</th>
   <th>Engine version</th>
   <th>CSS grade</th>
  </tr>
 </tfoot>
</table>
</div>
While initialization of the table plugin, we are using bServerSide and bProcessing to true, sPaginationType to full_number and finally sAjaxSource to controller action.

Controller action-
        public ActionResult Pagination_With_Data_Table_issue()
        {
            return View();
        }

        public ActionResult Pagination_With_Data_Table_issue_getData(TableParameter param)
        {
            var data = new[]{   
                new []{"Trident test","Internet Explorer 4.0","Win 95+","4","X"},
             new []{"Trident","Internet Explorer 5.0","Win 95+","5","C"},
             new []{"Trident","Internet Explorer 5.5","Win 95+","5.5","A"},
             new []{"Trident","Internet Explorer 6","Win 98+","6","A"},
             new []{"Trident","Internet Explorer 7","Win XP SP2+","7","A"},
             new []{"Trident","AOL browser (AOL desktop)","Win XP","6","A"},
             new []{"Gecko","Firefox 1.0","Win 98+ / OSX.2+","1.7","A"},
             new []{"Gecko","Firefox 1.5","Win 98+ / OSX.2+","1.8","A"},
             new []{"Gecko","Firefox 2.0","Win 98+ / OSX.2+","1.8","A"},
             .
                .
                .
                .
                .
            };

            var pagedData = data.Skip(param.iDisplayStart).Take(param.iDisplayLength);

            return Json(new
            {
                sEcho = param.sEcho,
                iTotalRecords = data.Count(),
                iTotalDisplayRecords = data.Count(),
                aaData = pagedData
            }, JsonRequestBehavior.AllowGet);
        }
In this case we are using the input parameter for filtering the correct data. Finally the return JSON matches the format explained in the second case. The array of data we have prepared form the following link-

http://datatables.net/examples/examples_support/json_source.txt

This explains everything. Let me know for any query. You can download the code here.